

POS Reports in MultiPOS for WCFM
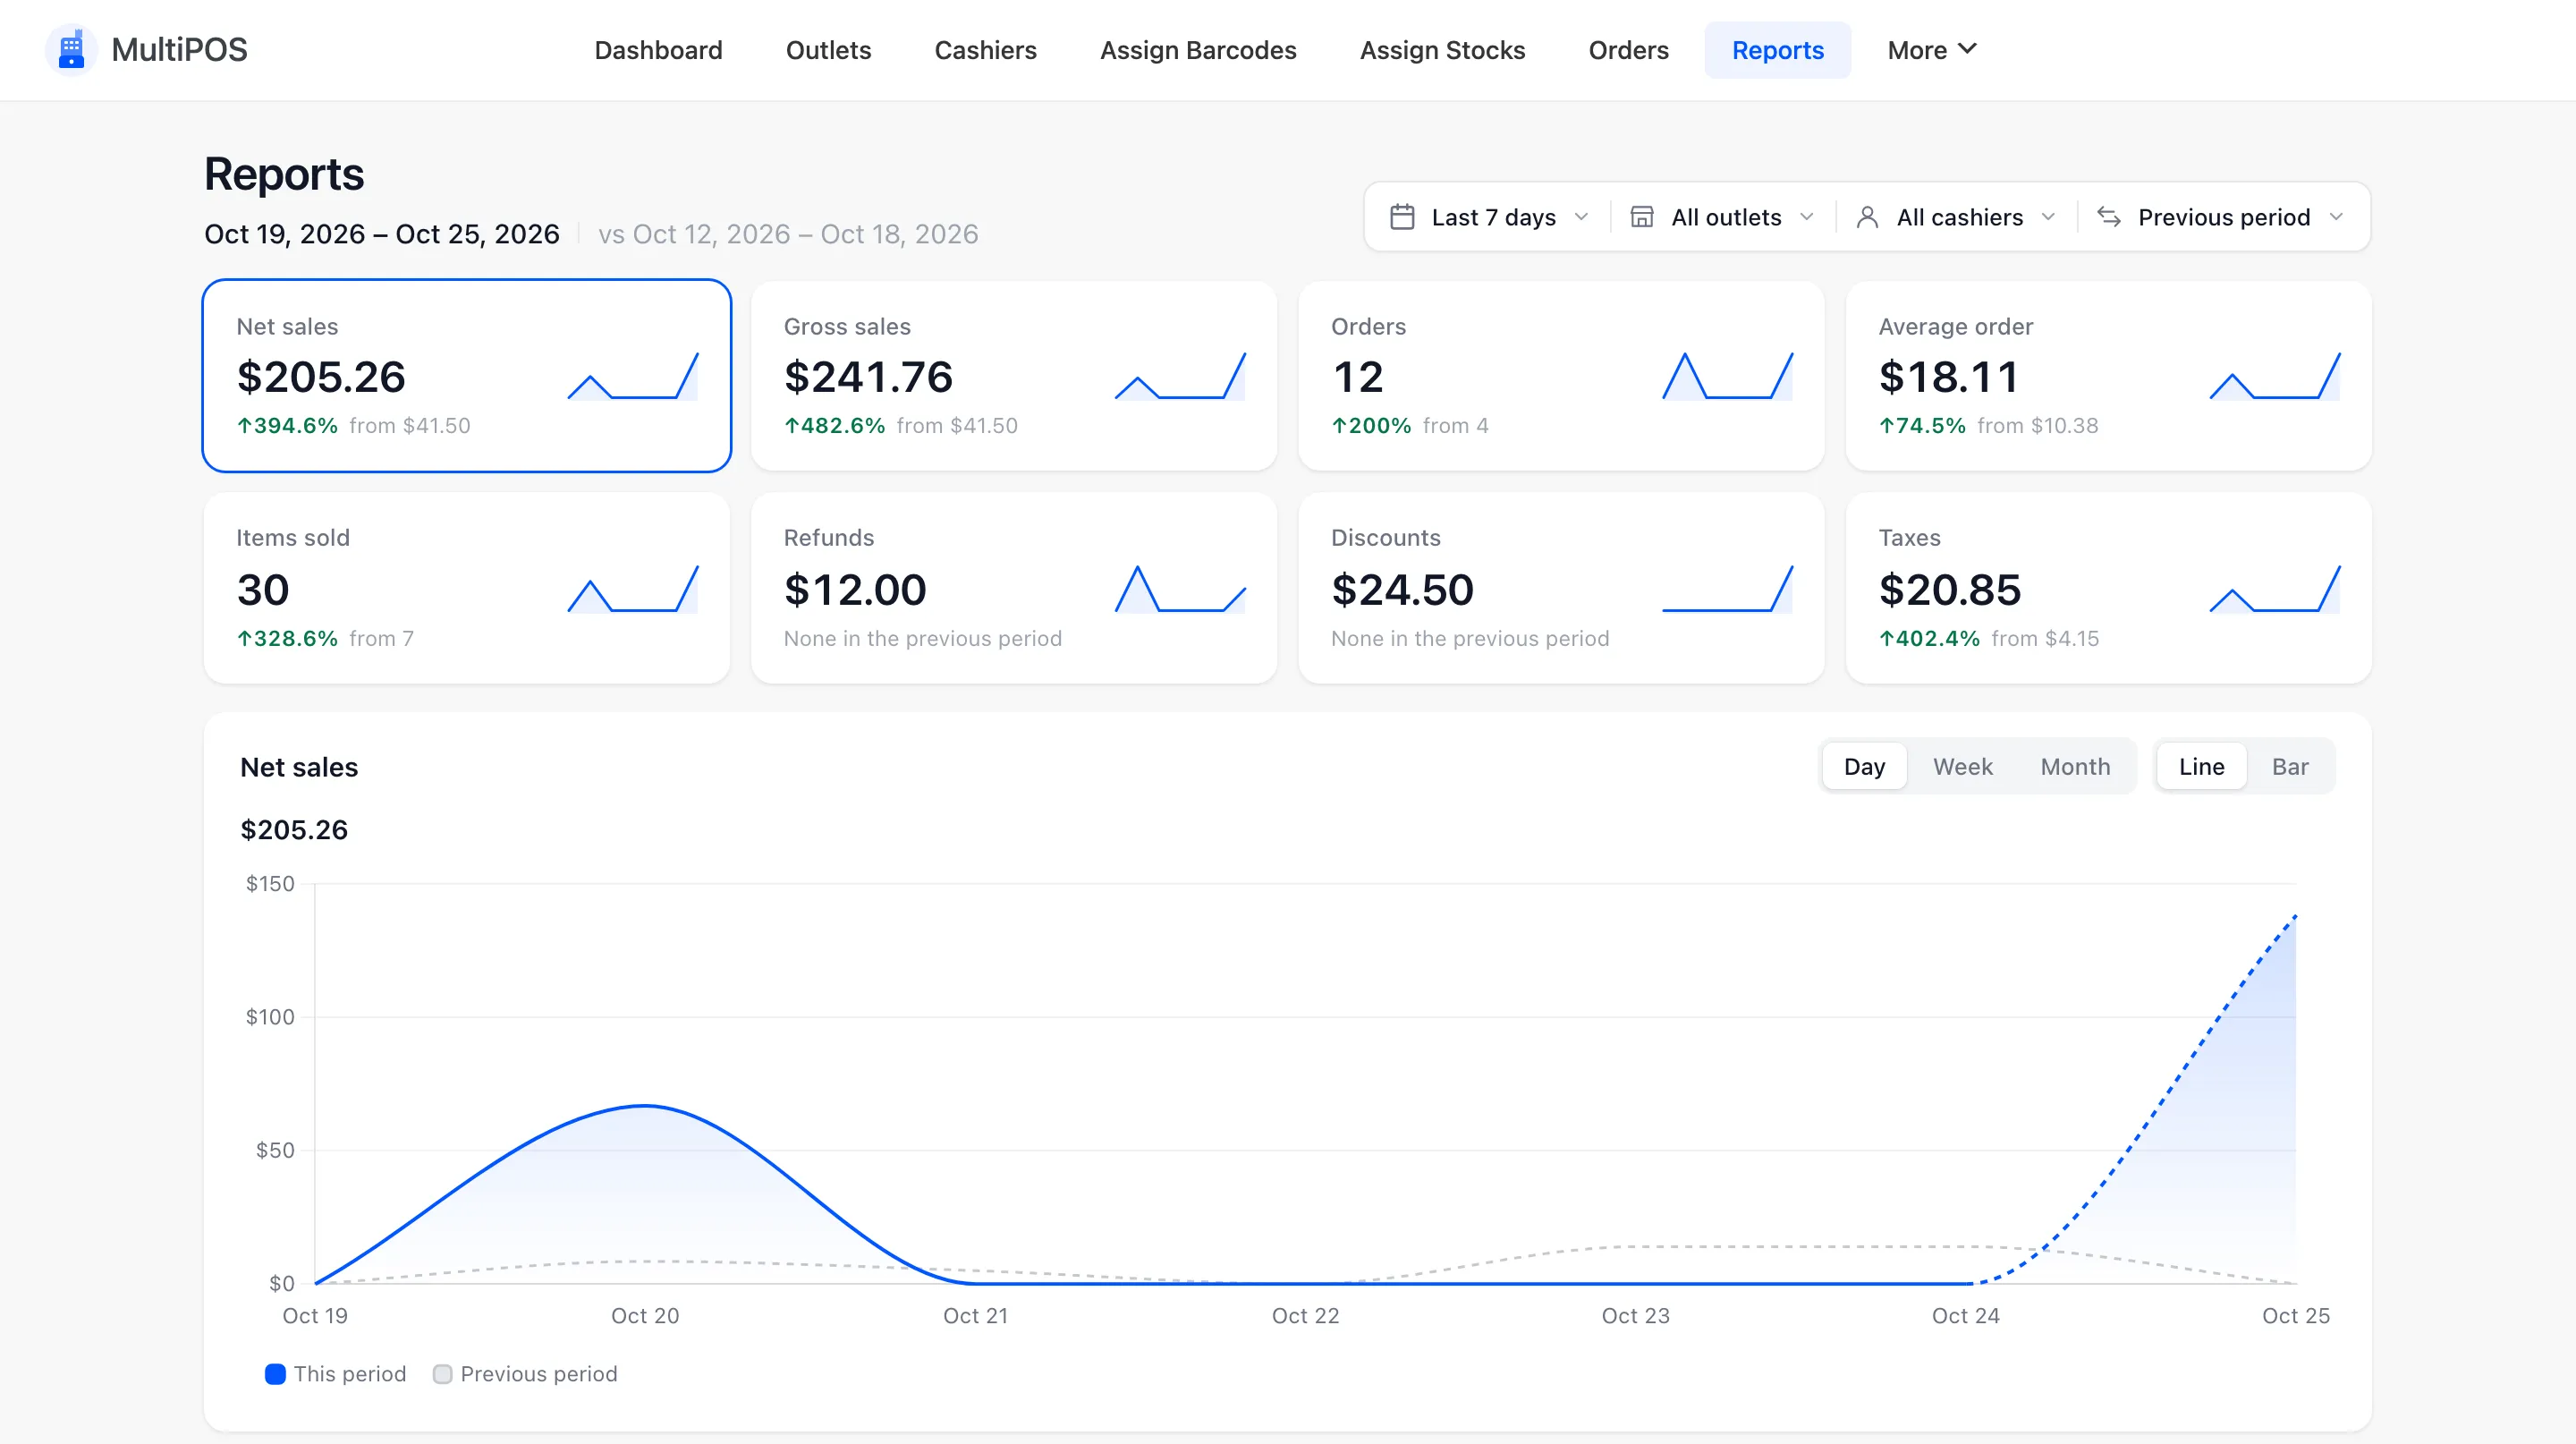
Reports is the detail behind the dashboard, on one page. It shows what sold, who sold it, how customers paid, when the counter is busy and whether the drawers balanced.
The owner opens it under DevDiggers Plugins → MultiPOS → Reports and sees every vendor’s POS sales. A vendor opens Point of Sale → Reports in the store manager, where the same page covers only their own outlets and cashiers.
Who can open it
Section titled “Who can open it”- The marketplace owner and shop managers: Every outlet in the marketplace.
- A vendor: Their own outlets, cashiers and sales. Another vendor’s figures never appear, and View registers opens the vendor’s own Registers screen.
- Cashiers: Not at all. Reports are for whoever runs the store.
Where the figures come from
Section titled “Where the figures come from”Reports reads the WooCommerce orders directly, so a sale shows up the moment it is taken. It does not need WooCommerce Analytics switched on. Only POS orders count, never orders placed on the website.
Orders in a status your store leaves out of reports are left out here too. By default that is Pending payment, Failed and Cancelled, set under WooCommerce → Settings → Advanced → Features.
- Gross sales: What the items and fees sold for before discounts, without tax and shipping.
- Discounts: Coupons, line discounts and the cart discount given at the counter.
- Refunds: The refunded amount without its tax, counted on the day of the refund.
- Net sales: Gross sales, less discounts, less refunds.
- Taxes: Tax collected, less any tax that was refunded.
These follow the way WooCommerce Analytics counts, so the two agree.
The filters
Section titled “The filters”Four controls at the top right filter everything on the page.
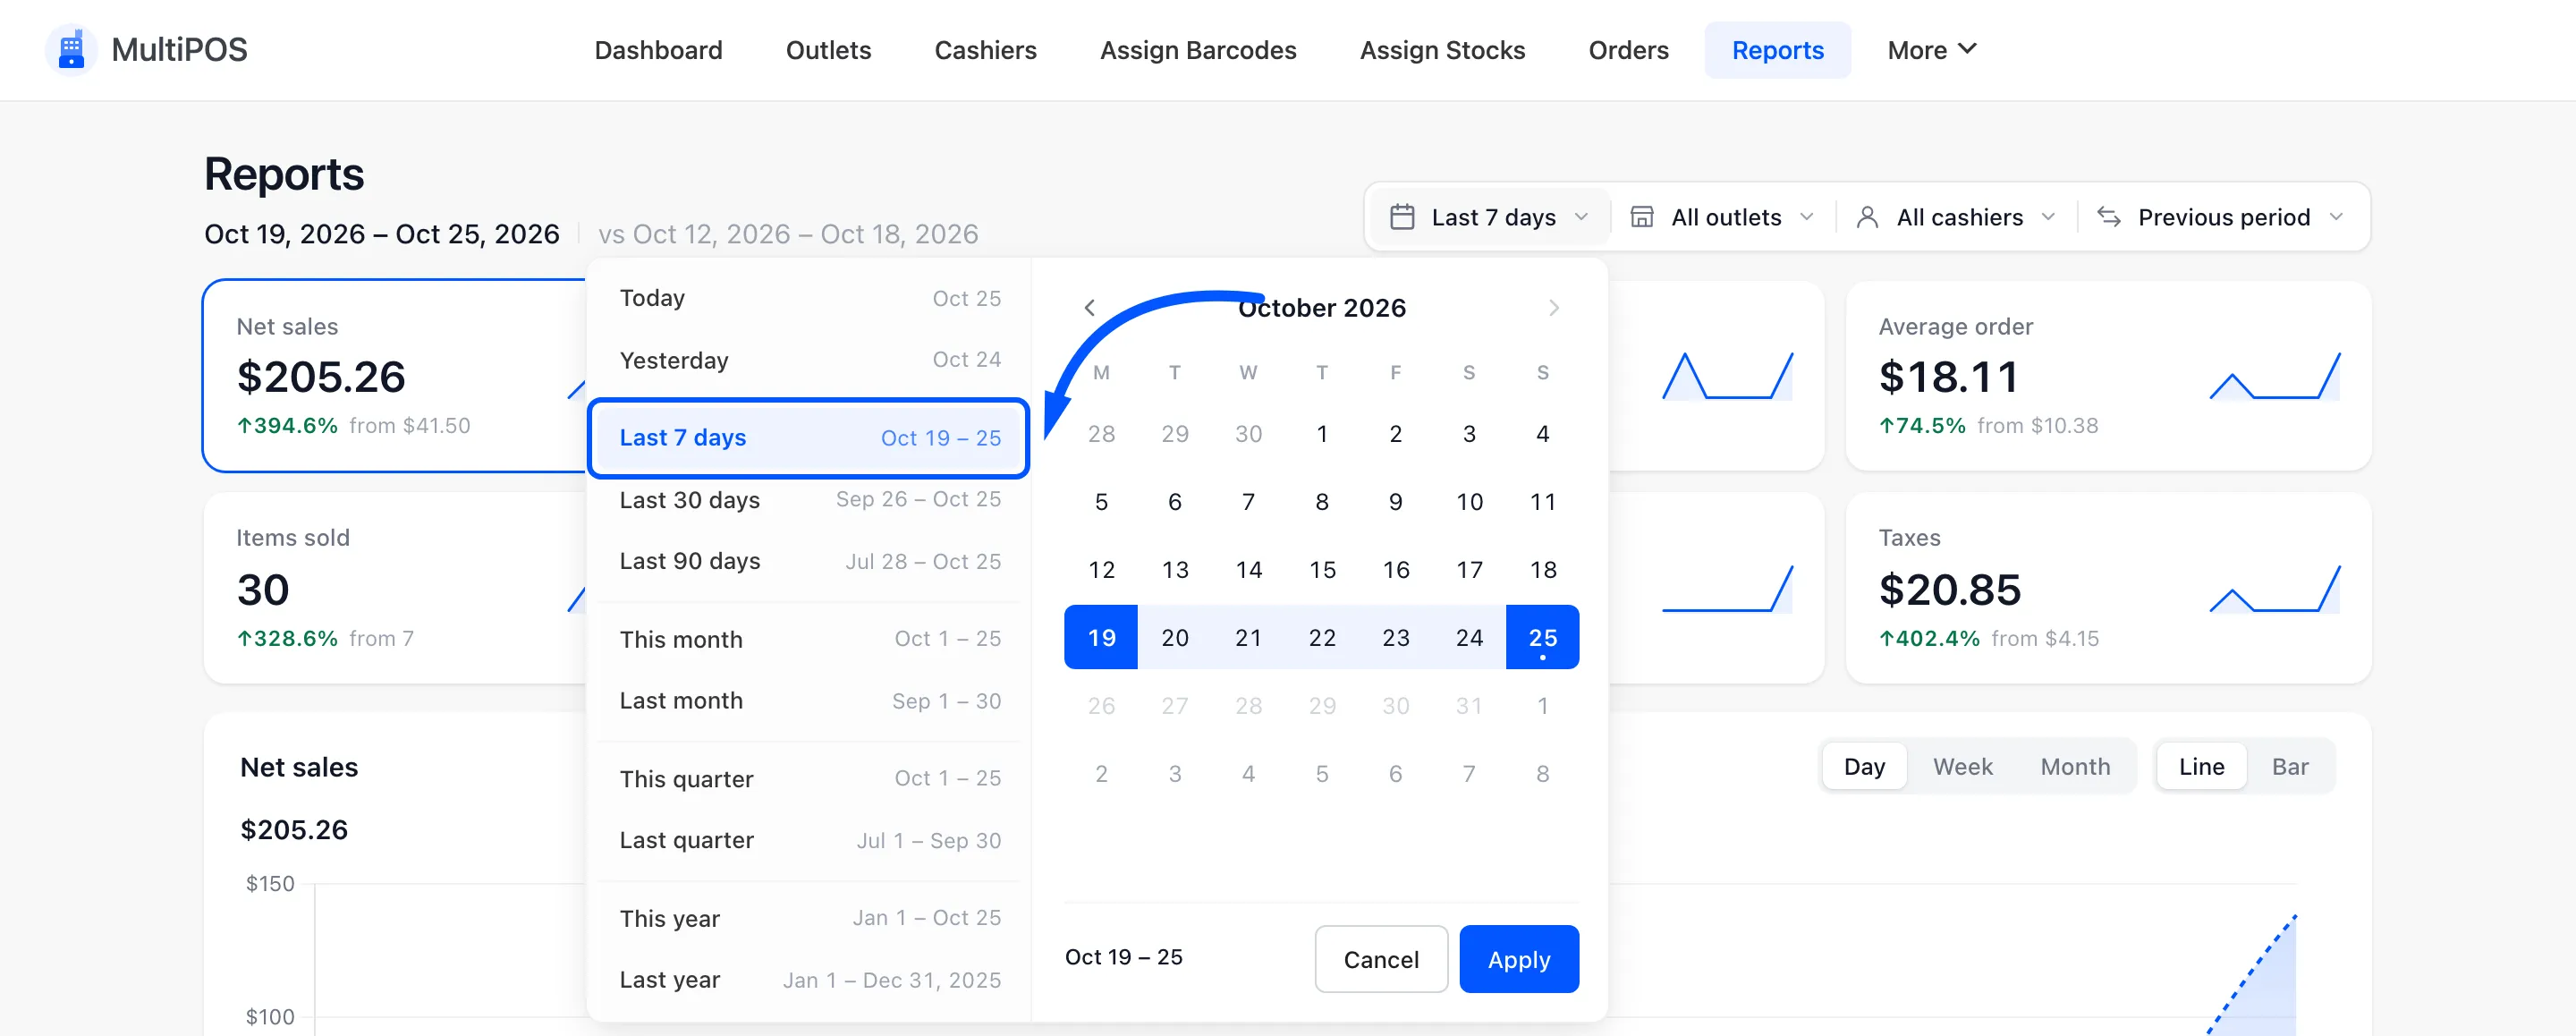
- Date range: Opens on Last 7 days. Pick a preset from Today to Last year, or two days on the calendar and Apply.
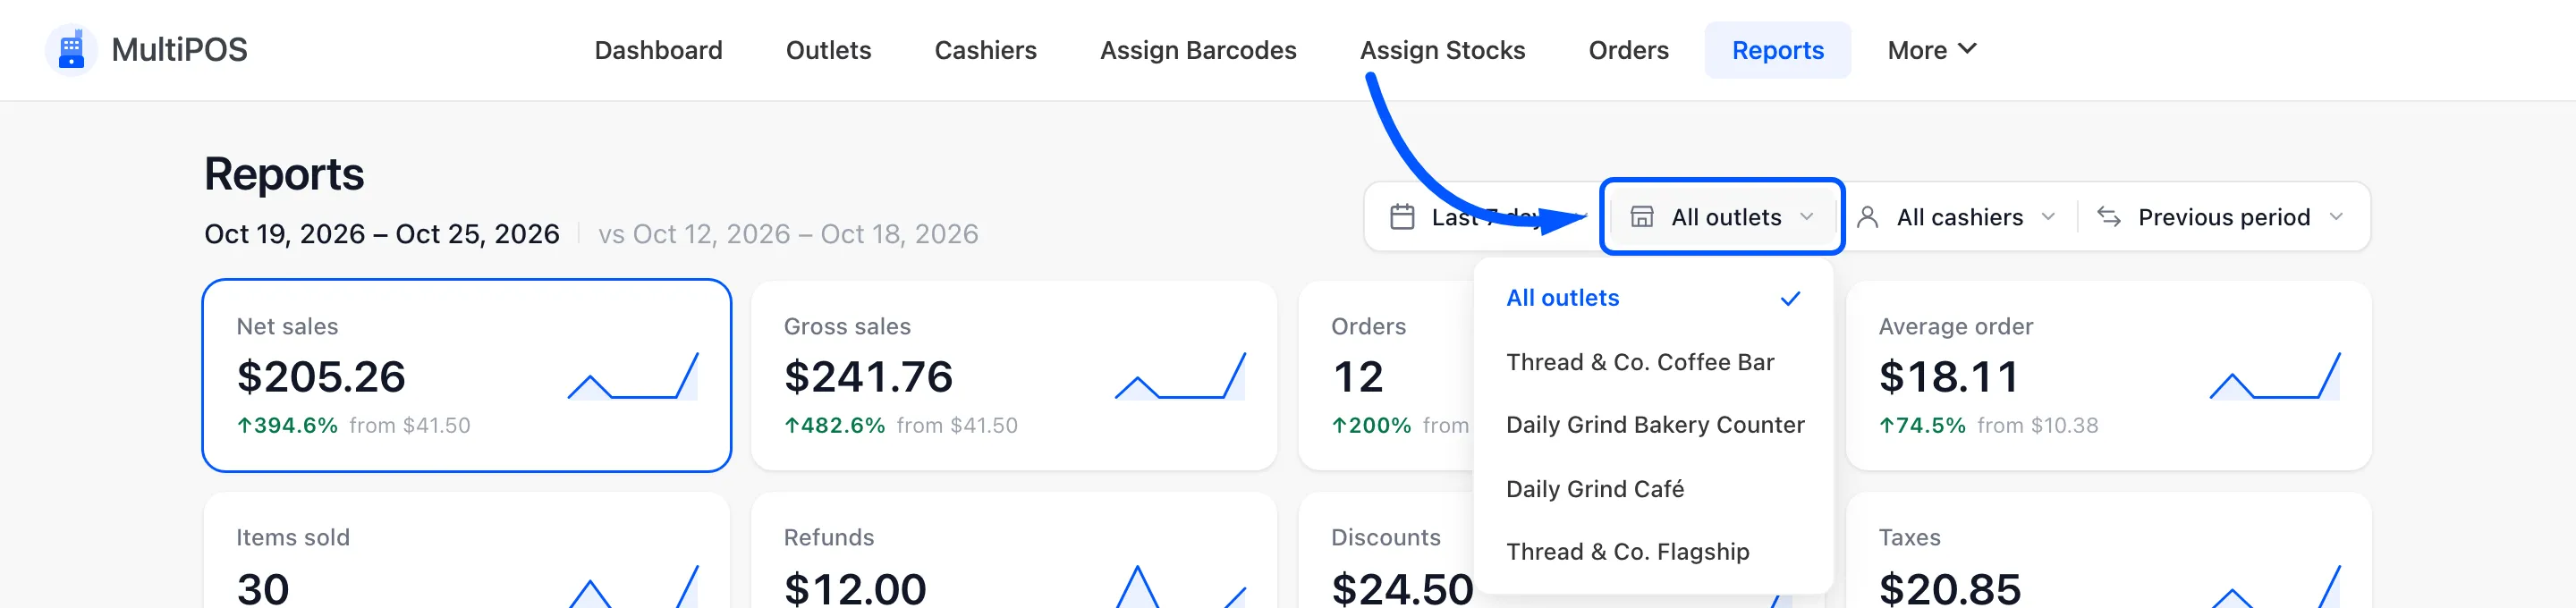
- Outlet: All outlets, or one. A vendor’s list holds their outlets only. Outlets that share a name show their ID.
- Cashier: All cashiers, or one person’s sales.
- Comparison: Previous period, Same period last year or No comparison.

The figure tiles and the chart
Section titled “The figure tiles and the chart”
Net sales, Gross sales, Orders, Average order, Items sold, Refunds, Discounts and Taxes, each with a trend line and its change against the comparison. A rise in refunds or discounts shows in red. A tile with nothing to compare with says None in the previous period.
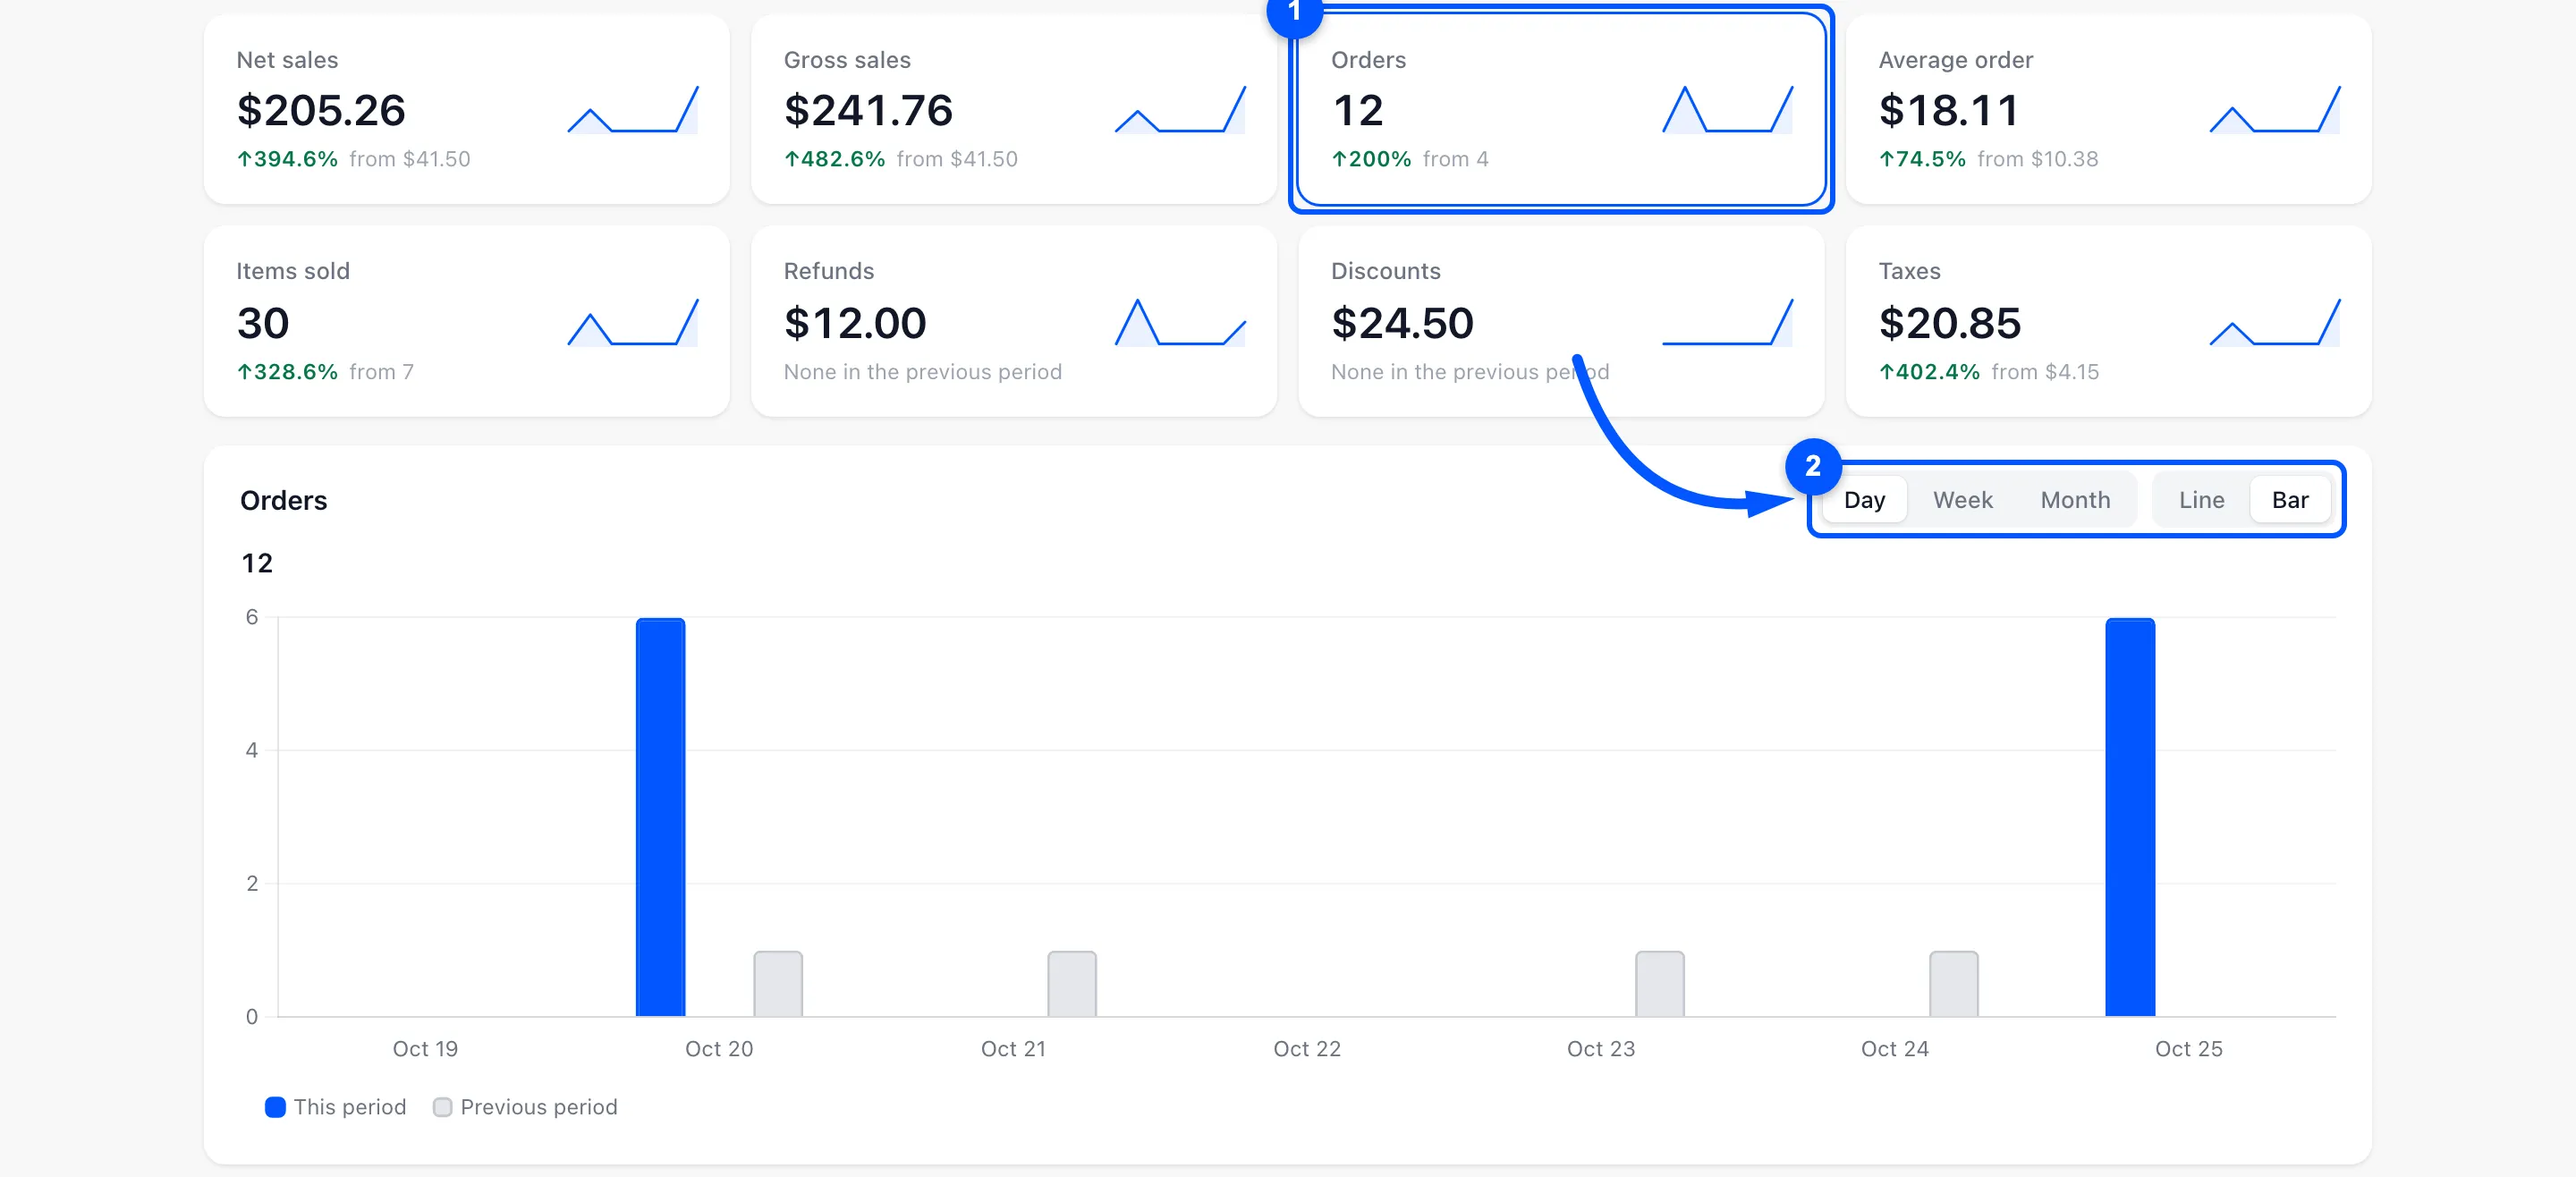
Click a tile to chart it. Day, Week and Month group the chart, and Line and Bar switch its type. The comparison period is drawn in grey, and the day still running is dotted and marked so far.
Busiest times and payment methods
Section titled “Busiest times and payment methods”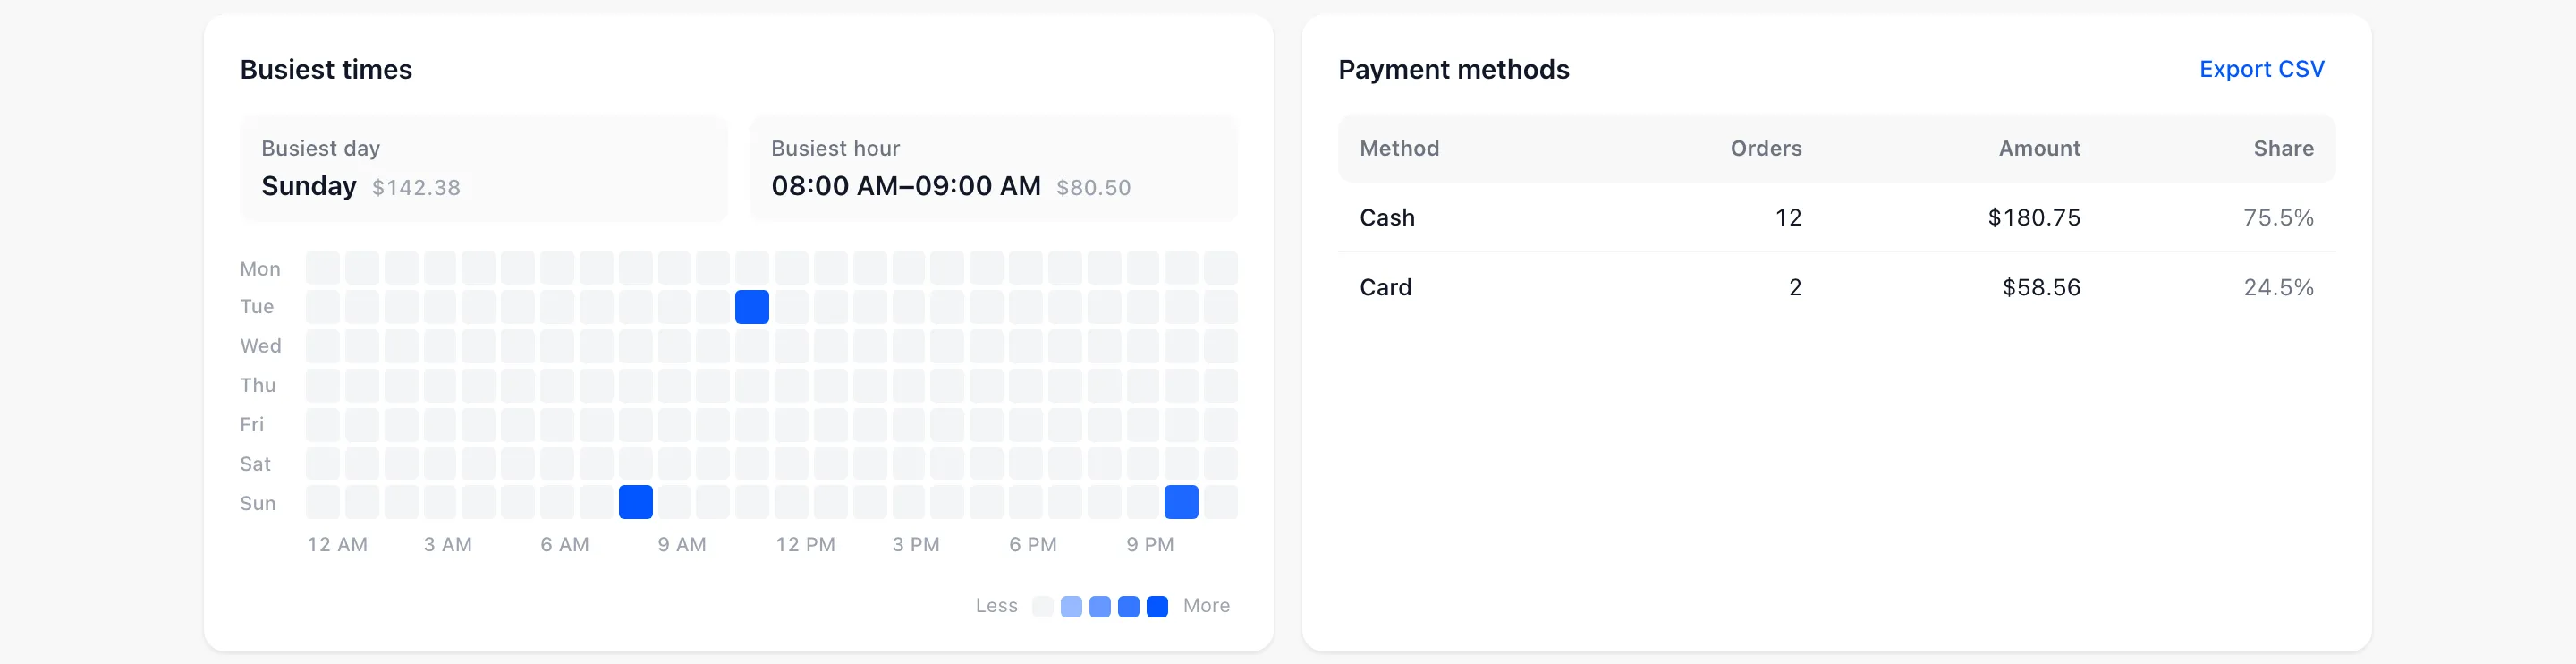
Busiest times is a grid of weekdays against hours, darker where more was sold, with the busiest day and hour named above it. Payment methods splits the sales by how customers paid. Change handed back is taken off the cash.
Cashiers
Section titled “Cashiers”
One row per cashier, highest net sales first: Orders, Discounts, Refunds, Cash in / out movements, Net sales, Share and Drawer. Drawer says Balanced, or how much their closed registers were over or short. A dash means they closed none.
Products, categories, customers and outlets
Section titled “Products, categories, customers and outlets”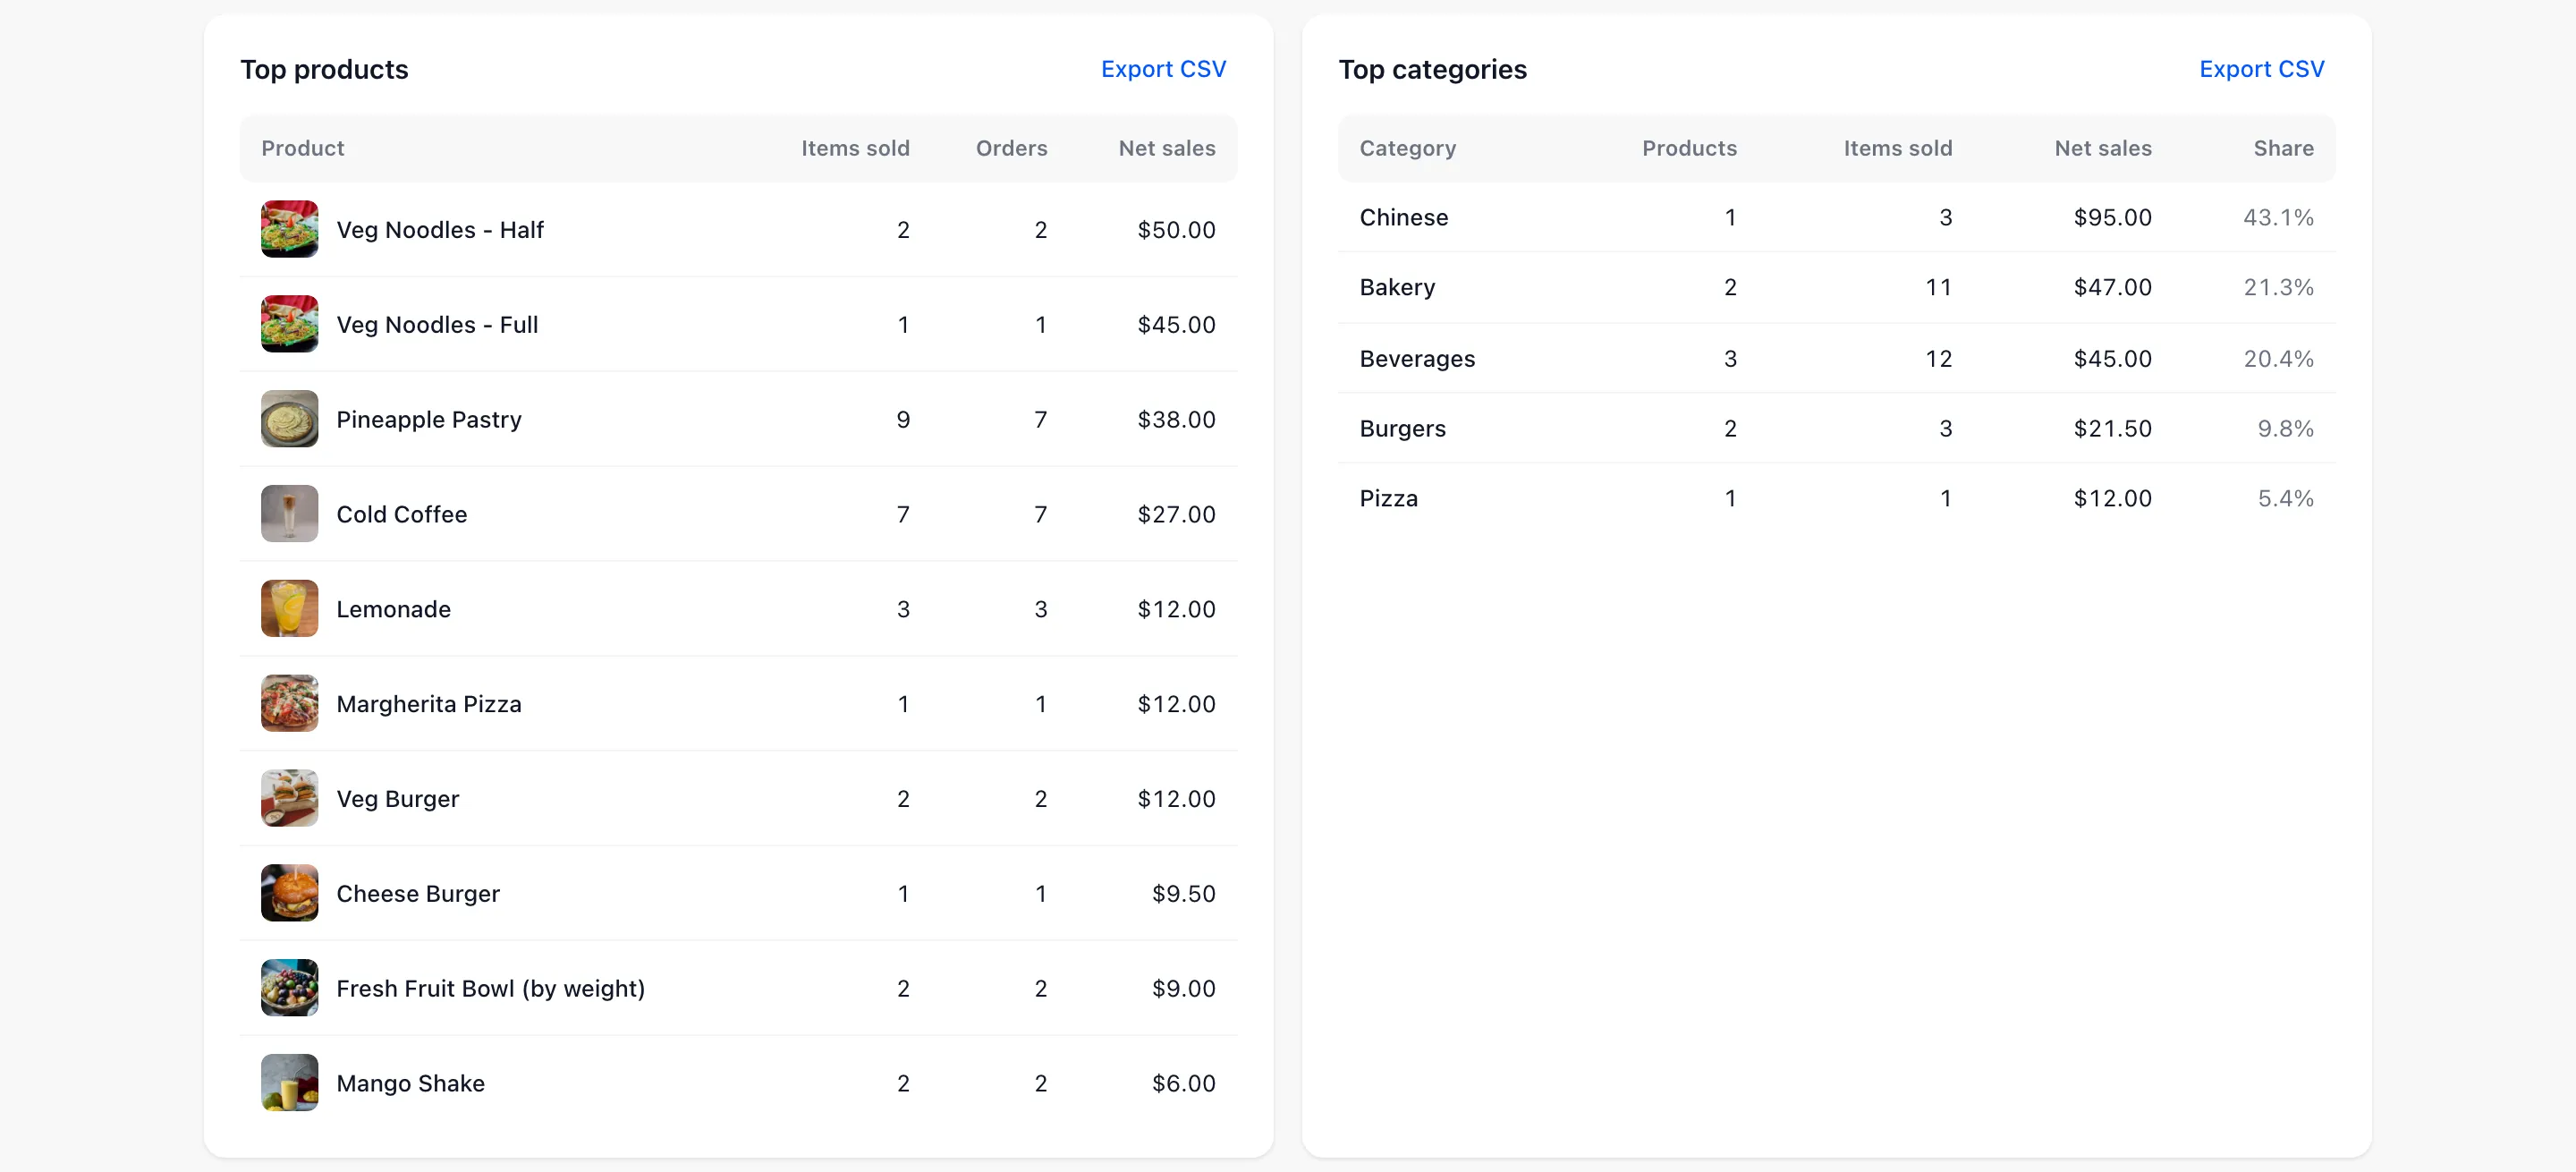
- Top products: The ten best sellers by net sales. The name opens the product.
- Top categories: Sales by product category, with each one’s share.
- Top customers: Named customers by what they spent. Walk-in sales on the guest account are left out.
- Outlets: Each outlet’s orders, average order, net sales and share.

Coupons, cash drawer and taxes
Section titled “Coupons, cash drawer and taxes”
- Coupons: Each coupon used at the counter, with orders and the discount it gave. A discount typed in by hand is not a coupon.
- Cash drawer: The period’s net over or short, and how many registers were closed and balanced. View registers opens the Registers screen.

- Taxes: Each tax rate with its orders, order tax, shipping tax and total.

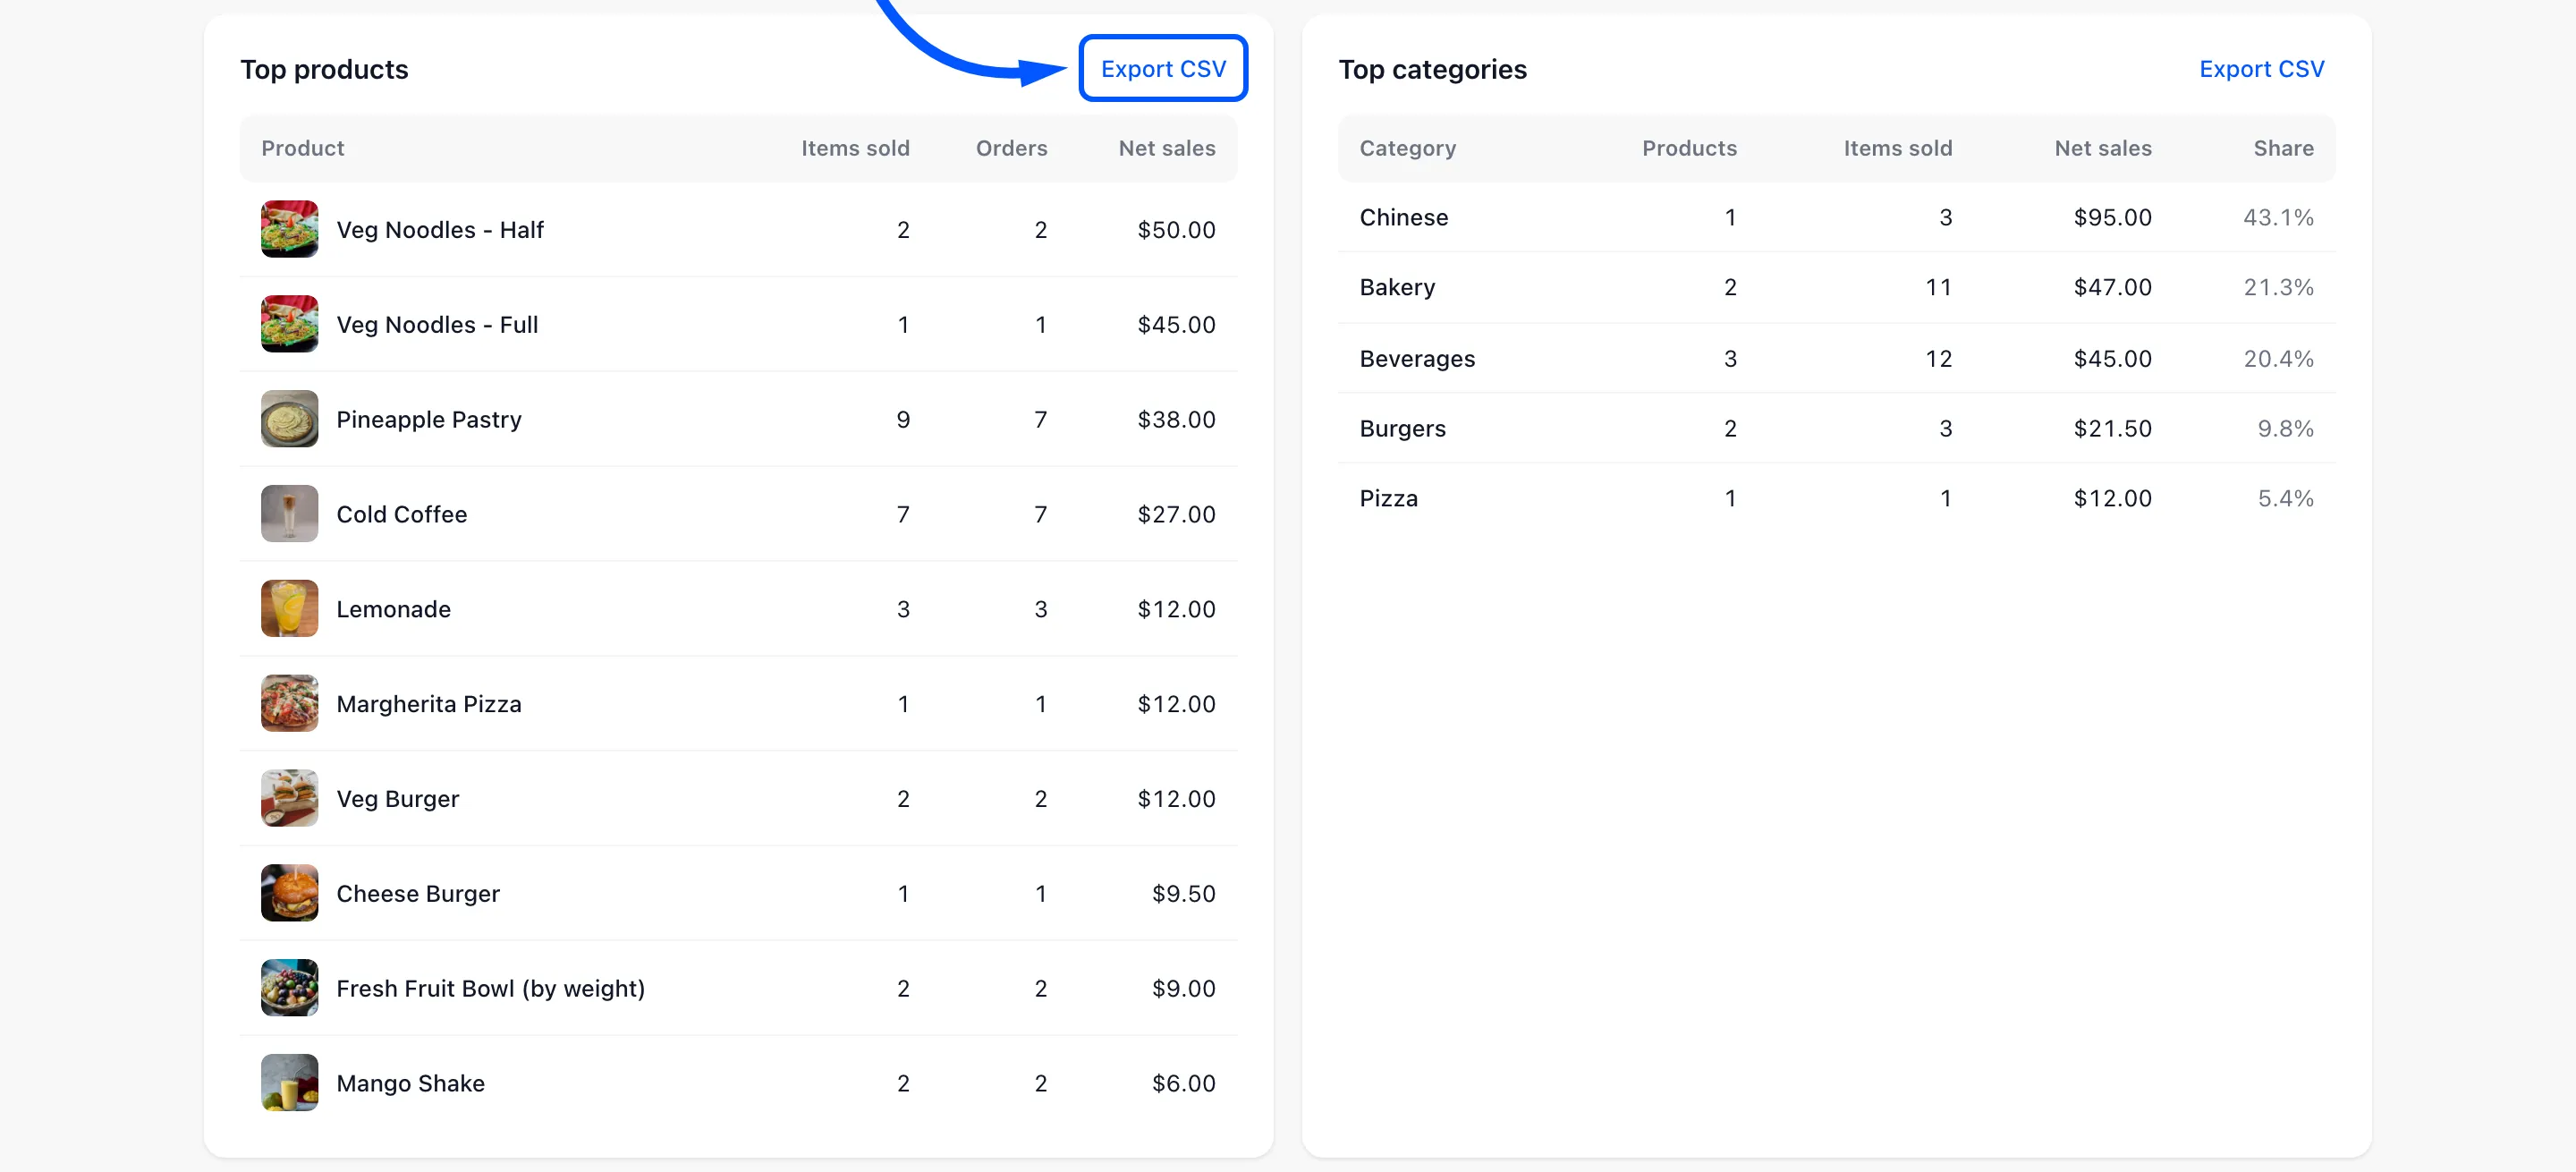
Every table has Export CSV at its top right, which downloads it for the dates and filters on screen.
The vendor’s Reports
Section titled “The vendor’s Reports”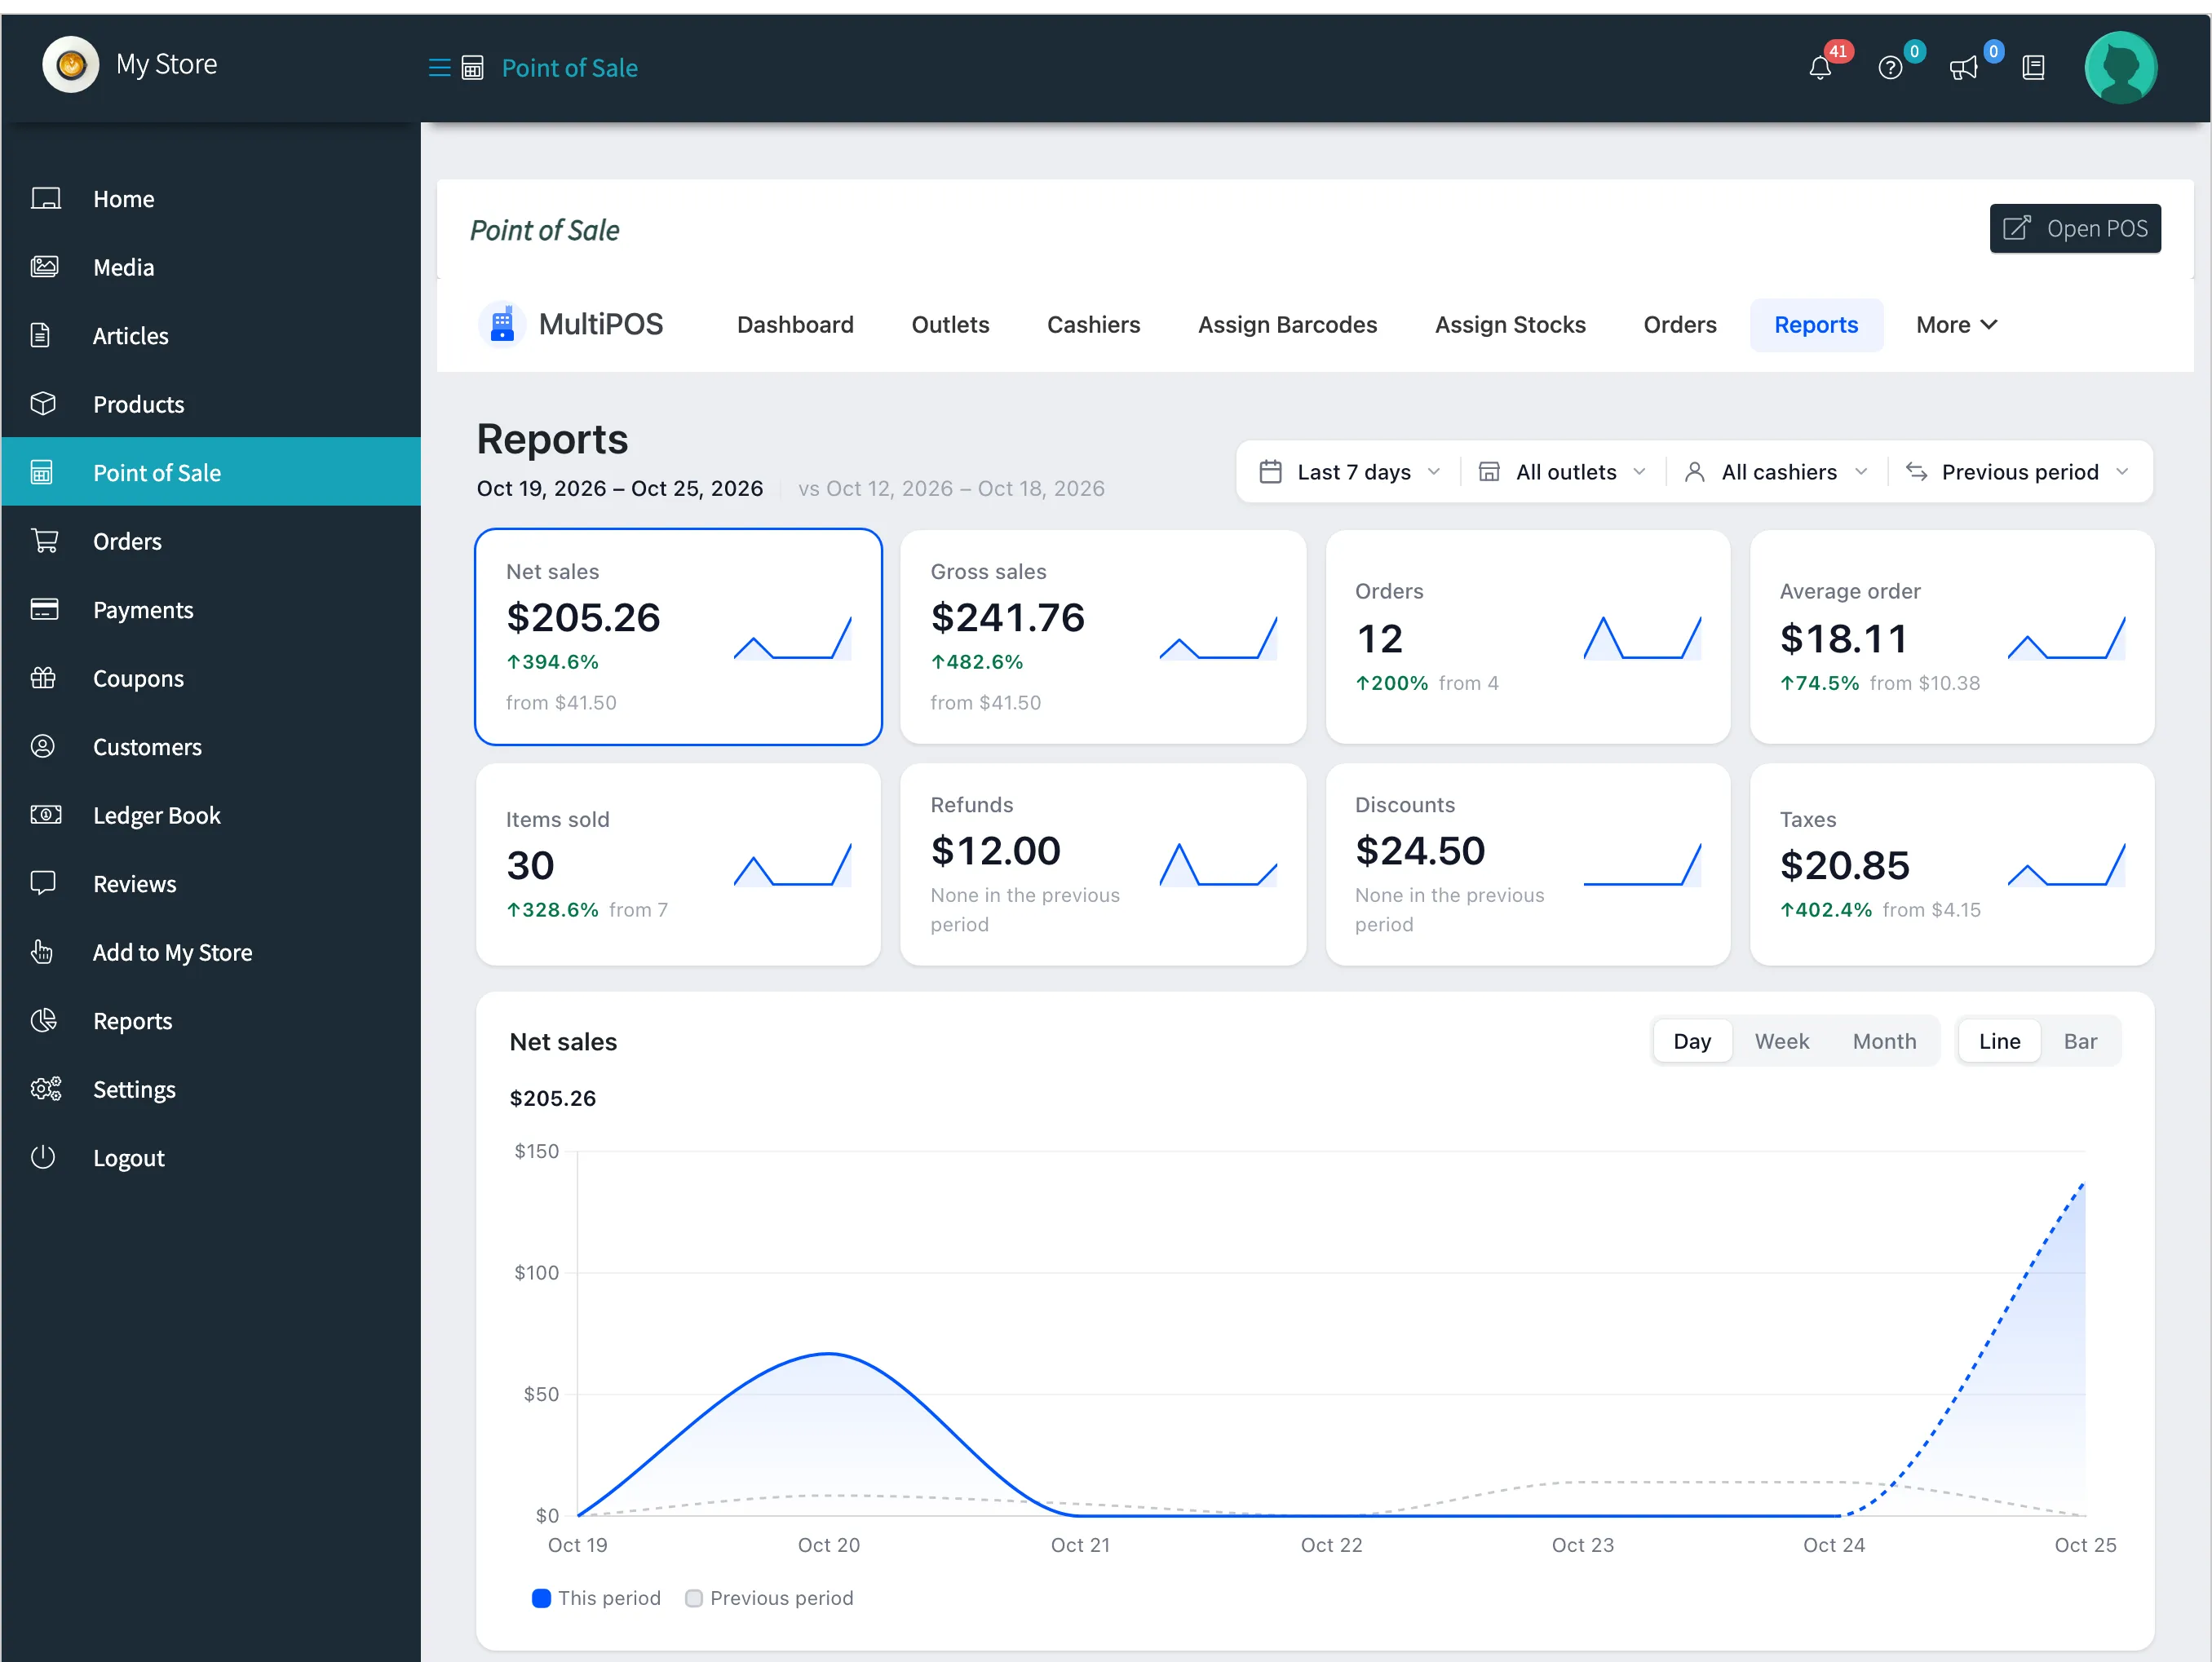
The vendor’s page is the same app inside the store manager, with the same filters, tiles and tables. Every figure covers that vendor’s store alone.
