

How to Read Your Affiliate Reports
Four screens report on the same data from different angles. Read in the right order they answer three questions, and read in the wrong order they mostly produce numbers.
Step 1: Fix the date range before anything else
Section titled “Step 1: Fix the date range before anything else”Every dated screen opens on This Month. A program that started six weeks ago looks dead on its own dashboard, and the first reaction is always to assume tracking is broken.
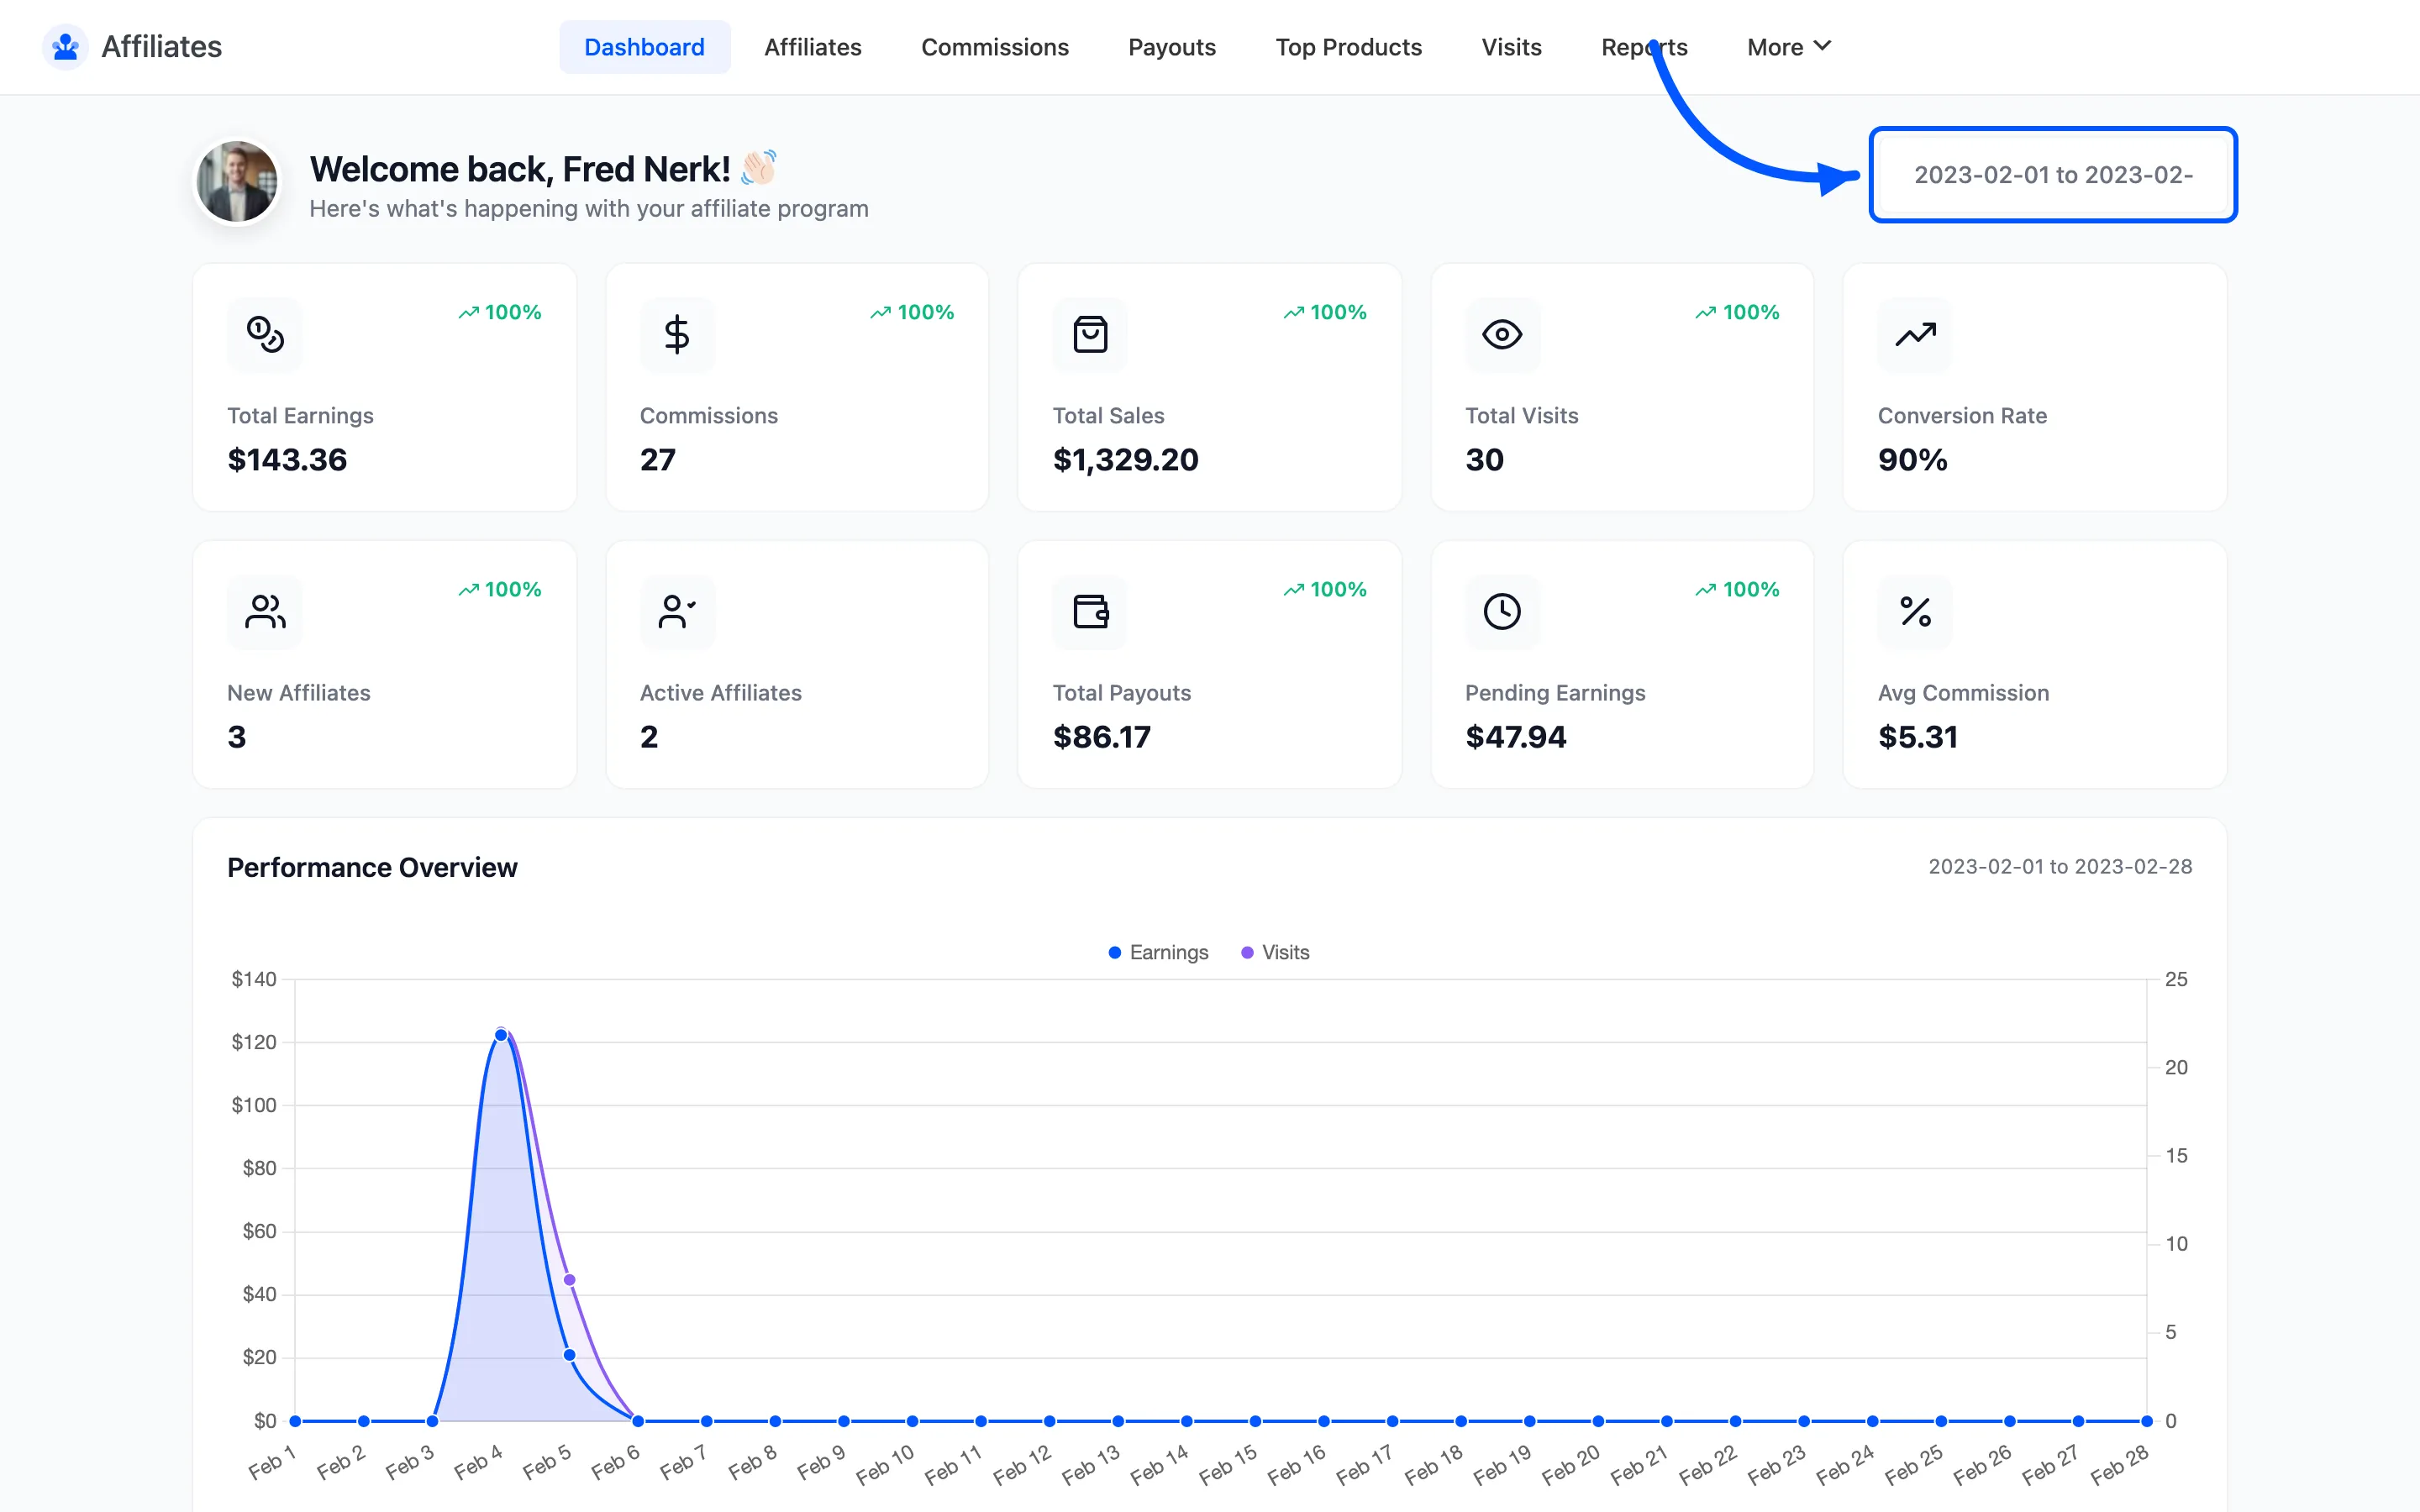
Widen it first. Do this before you conclude anything about a screen showing zeros.
Step 2: Read the dashboard summary
Section titled “Step 2: Read the dashboard summary”Go to DevDiggers Plugins → Affiliates → Dashboard.
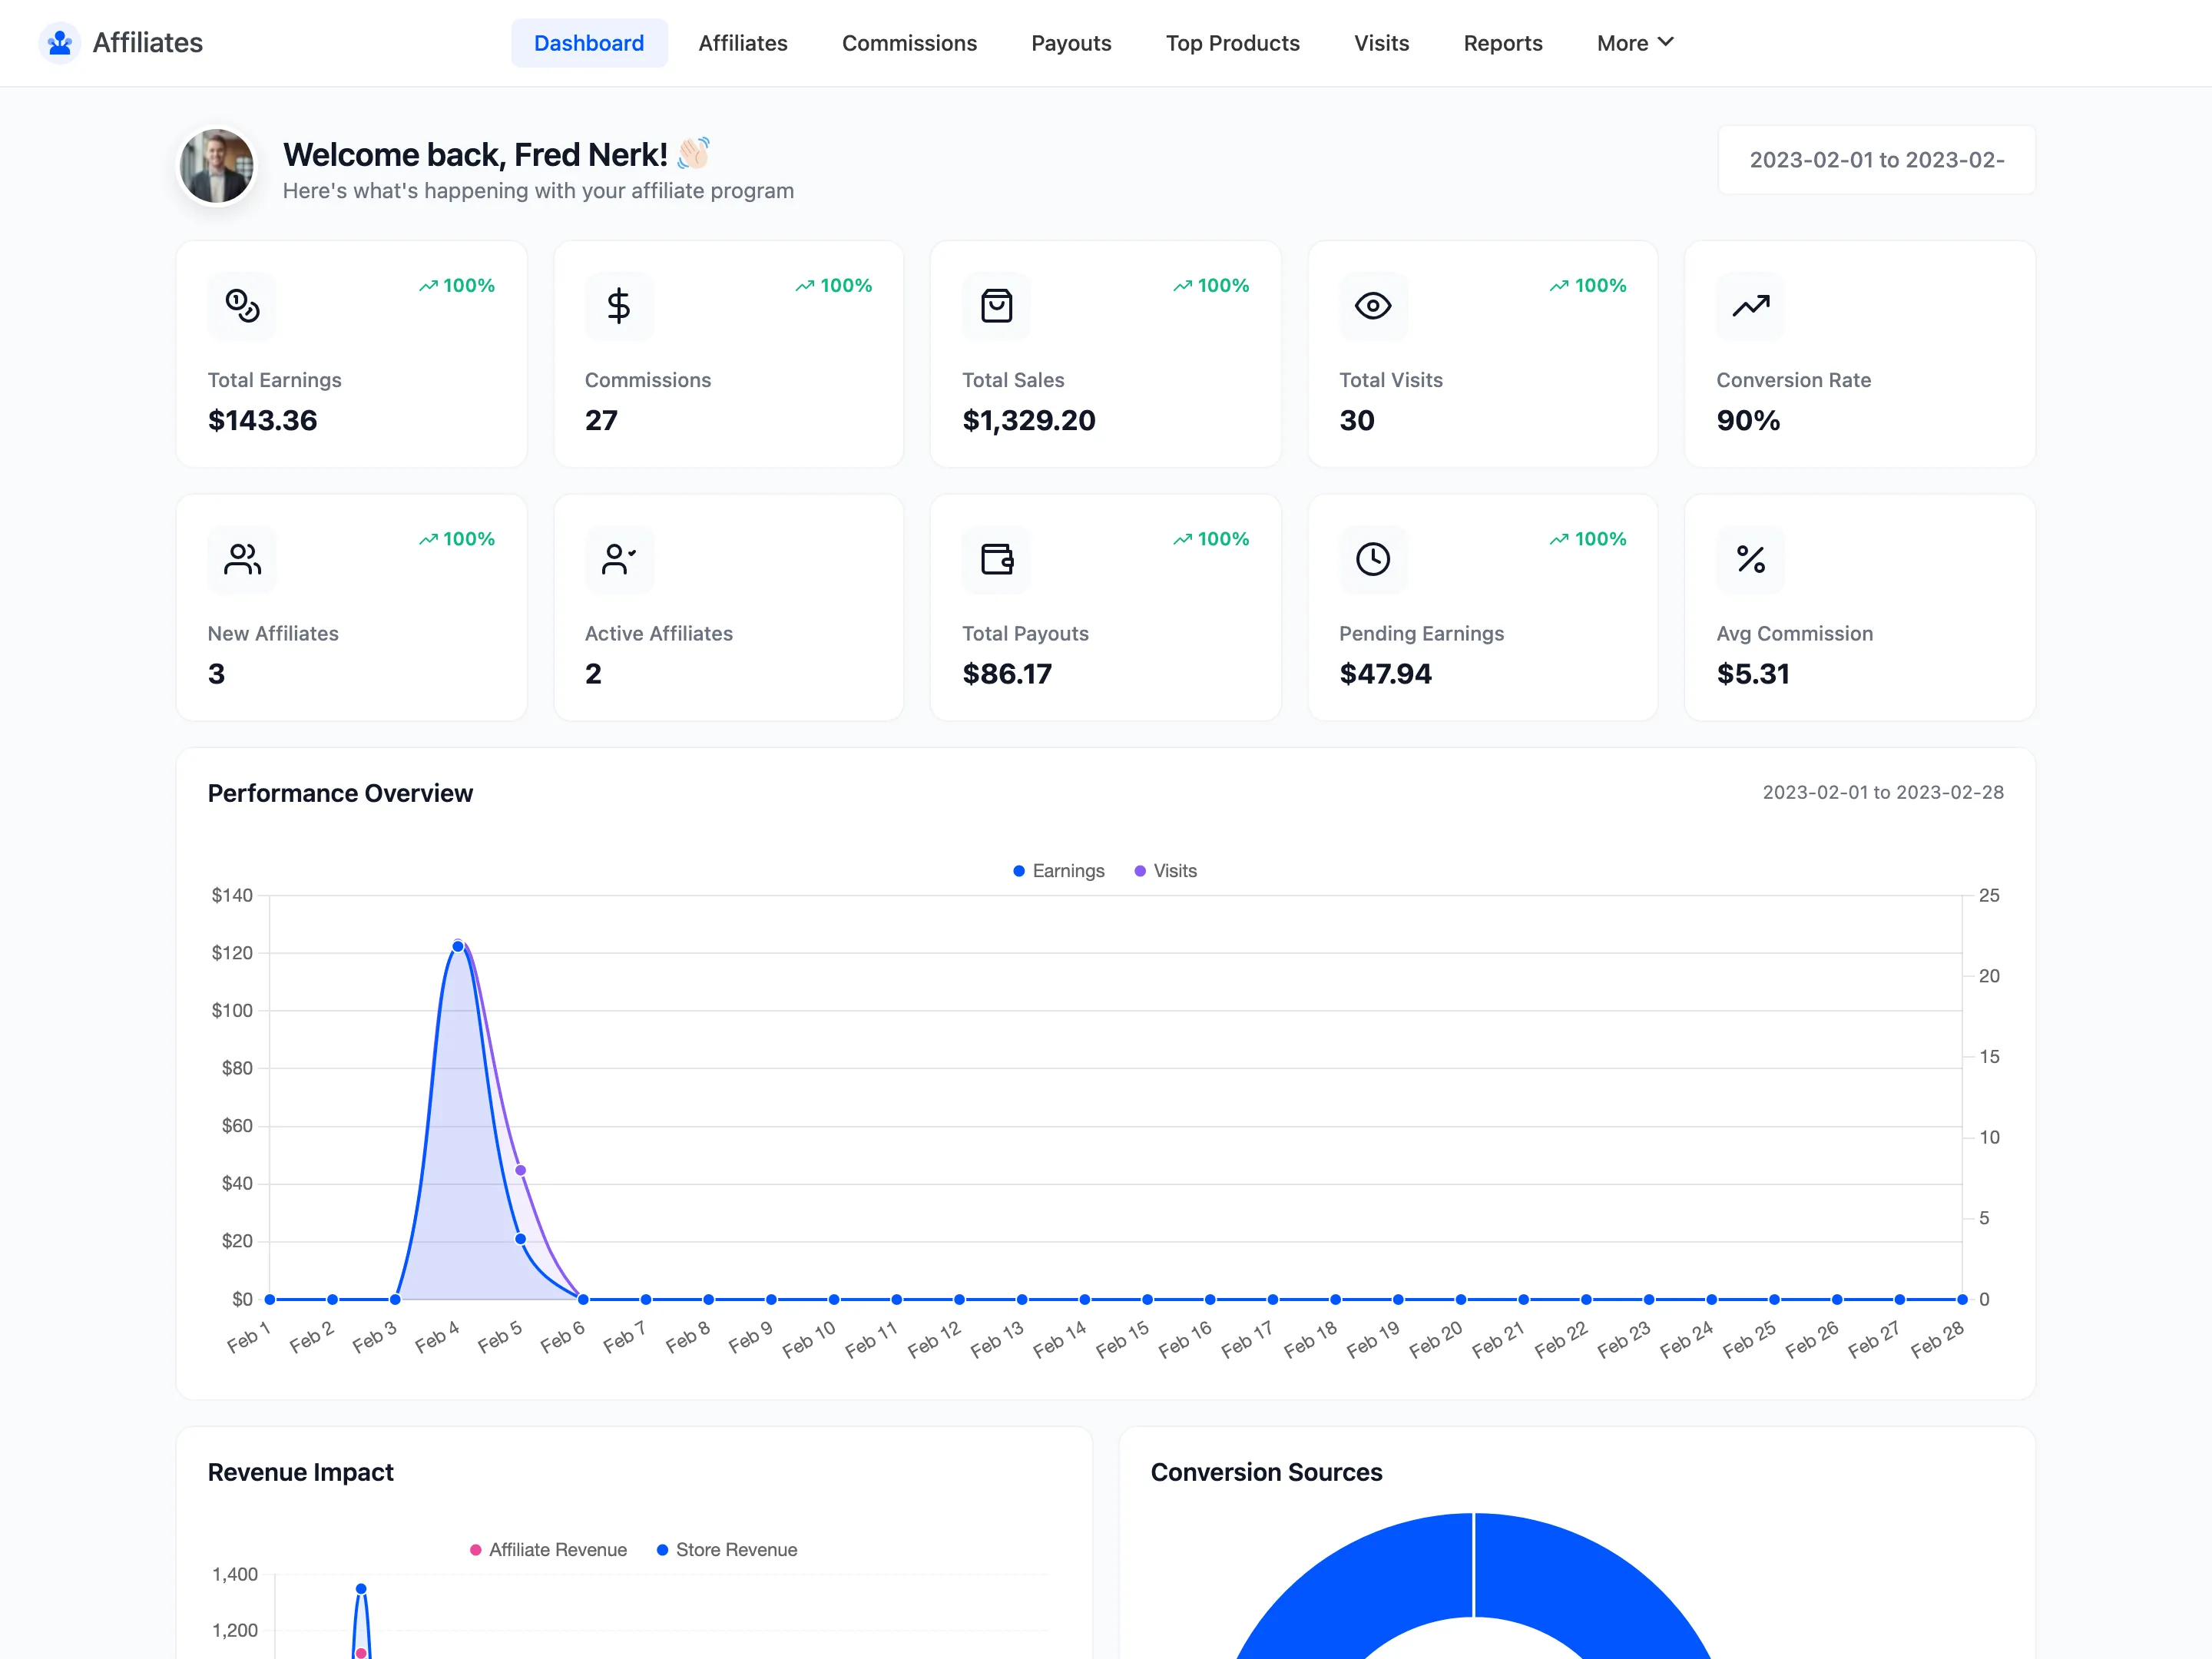
Ten cards, and two of them carry the answer.
Total Earnings is the order value your affiliates drove. Commissions is what that cost you. The ratio between them is the return on the entire program, and it is the only number worth quoting to anyone else.
The rest are supporting detail. Conversion Rate tells you whether the traffic is any good, and Pending Earnings tells you what you owe but have not paid. Avg Commission tells you whether one large order is carrying the month.
Step 3: Read the charts underneath
Section titled “Step 3: Read the charts underneath”Below the cards sit three charts and two widgets.
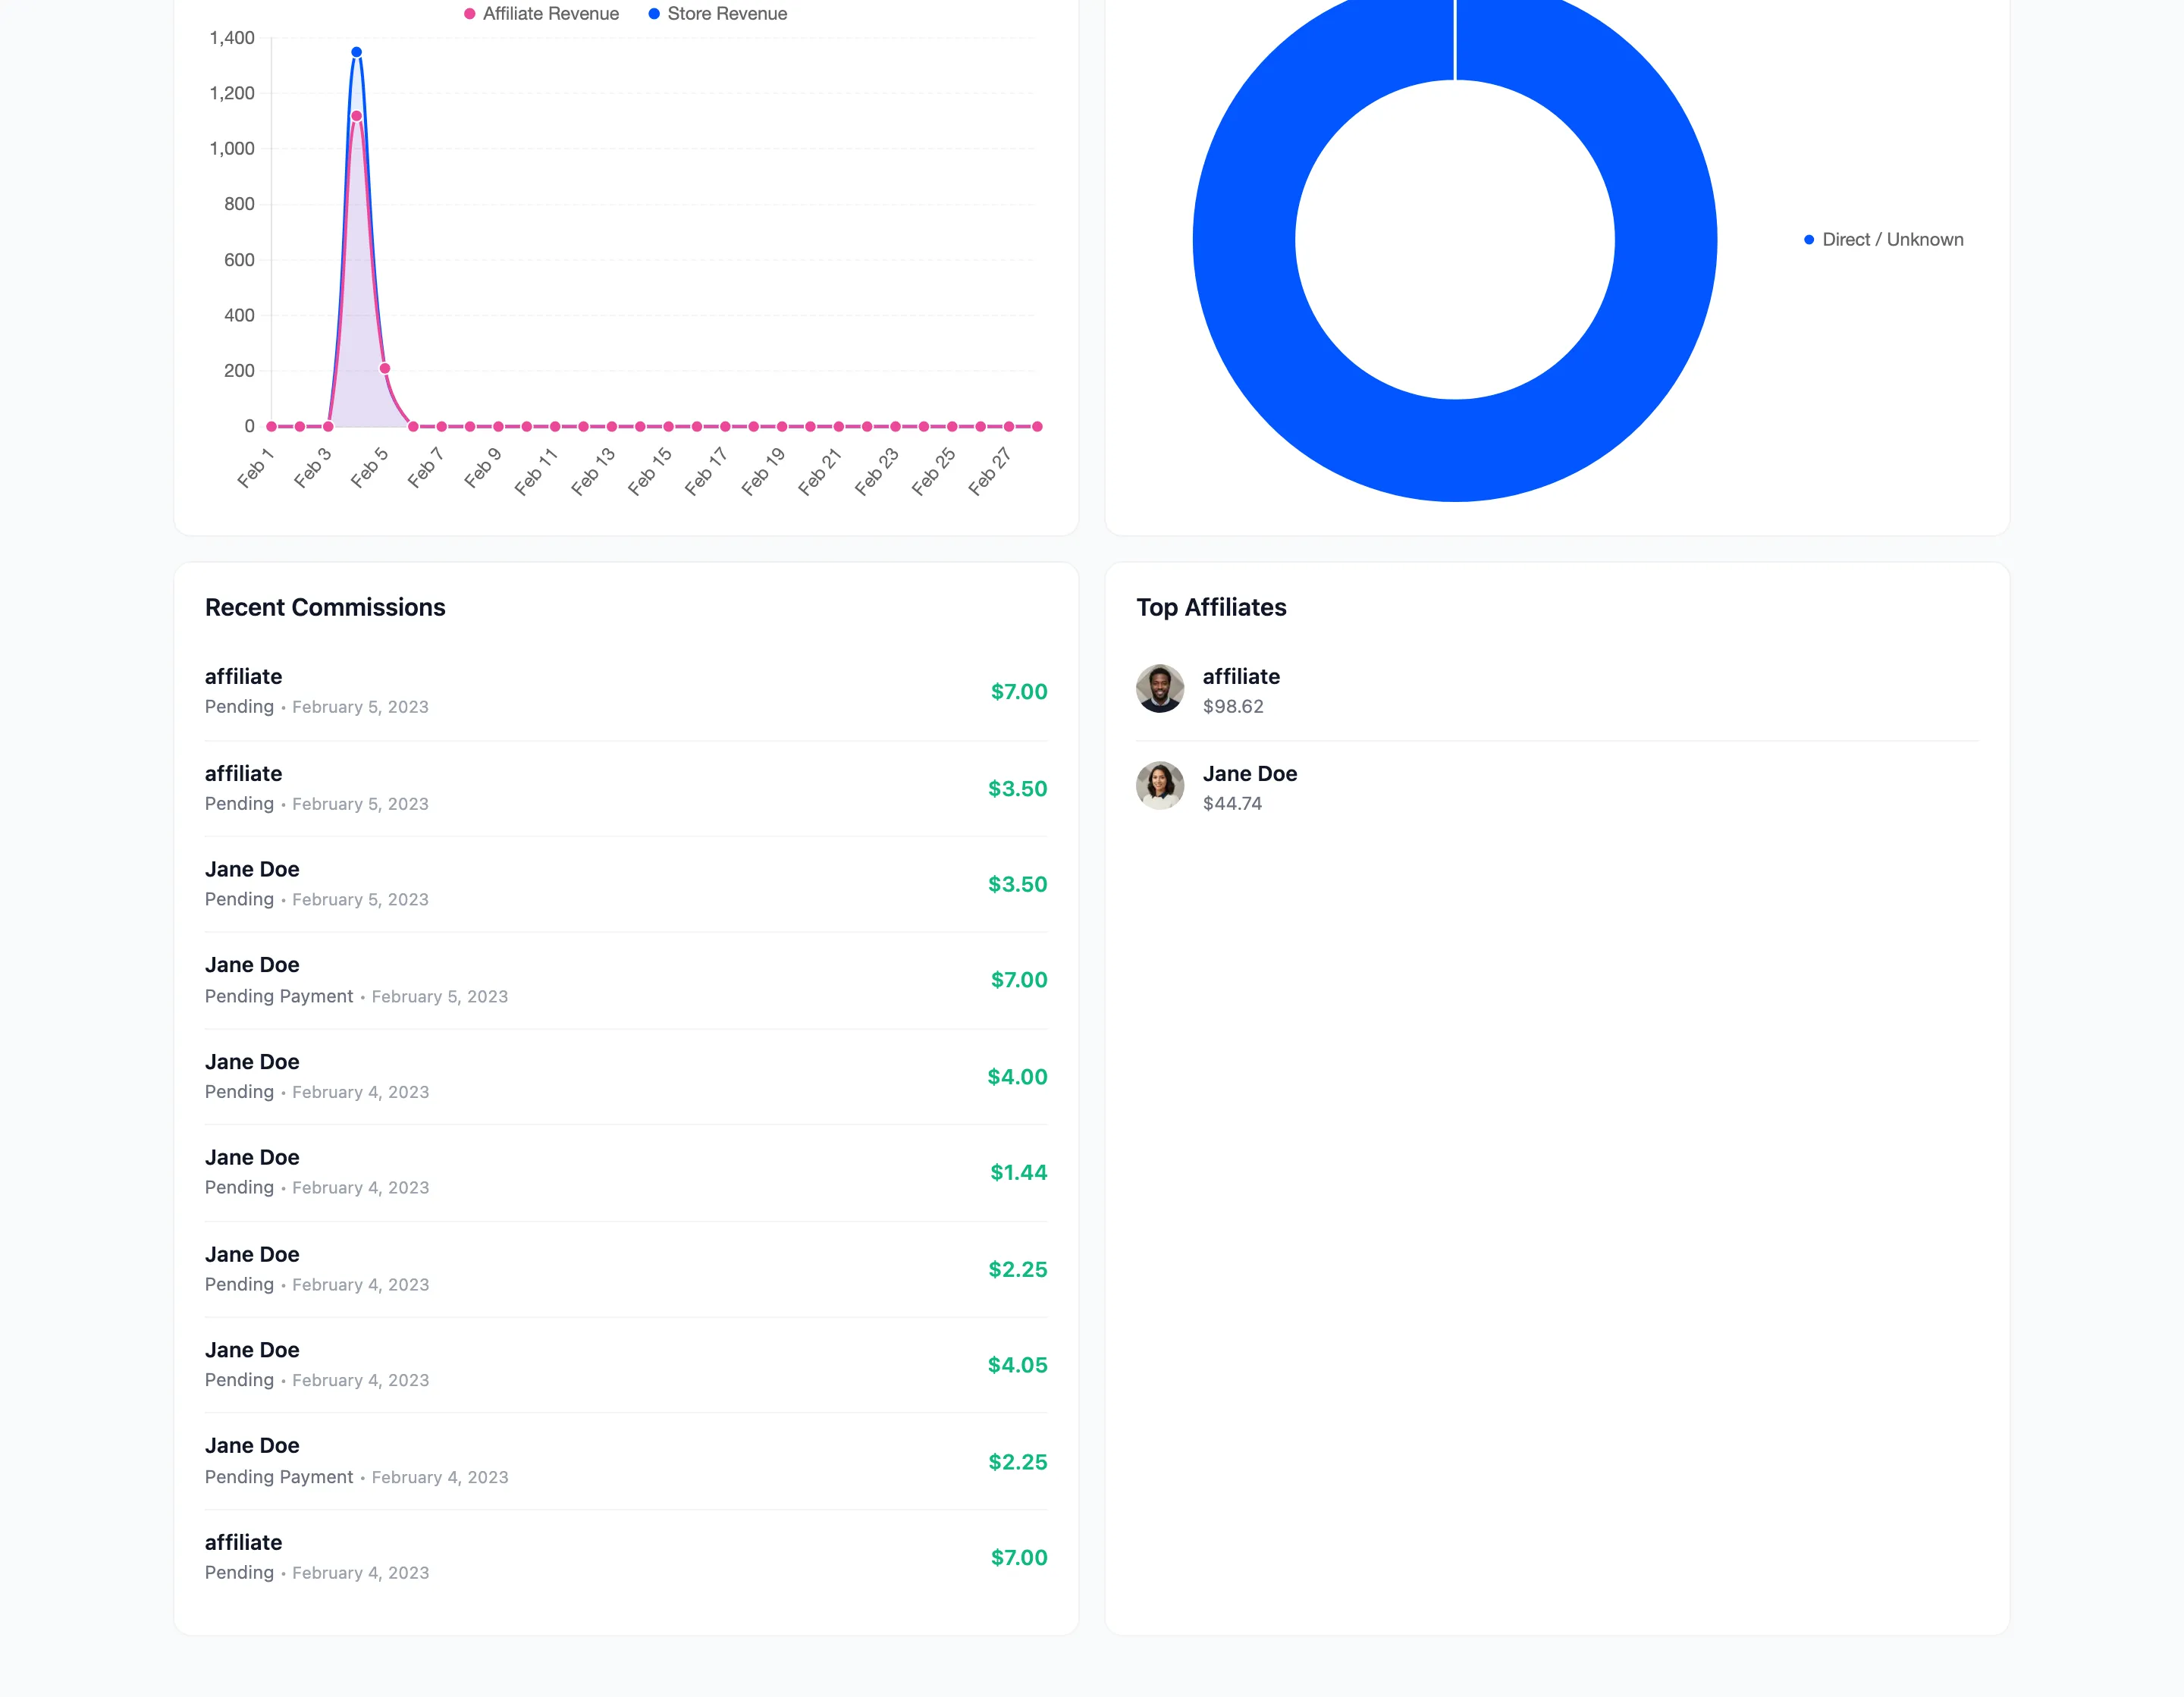
- Performance Overview plots earnings against visits on one pair of axes. When the two lines diverge you have your answer: visits up and earnings flat means traffic that does not convert.
- Revenue Impact puts affiliate revenue beside total store revenue, which is the share of your business the program represents.
- Conversion Sources breaks conversions down by where they came from.
Step 4: Compare periods on Reports
Section titled “Step 4: Compare periods on Reports”Reports is the analysis screen, with eight metrics over any range you choose.
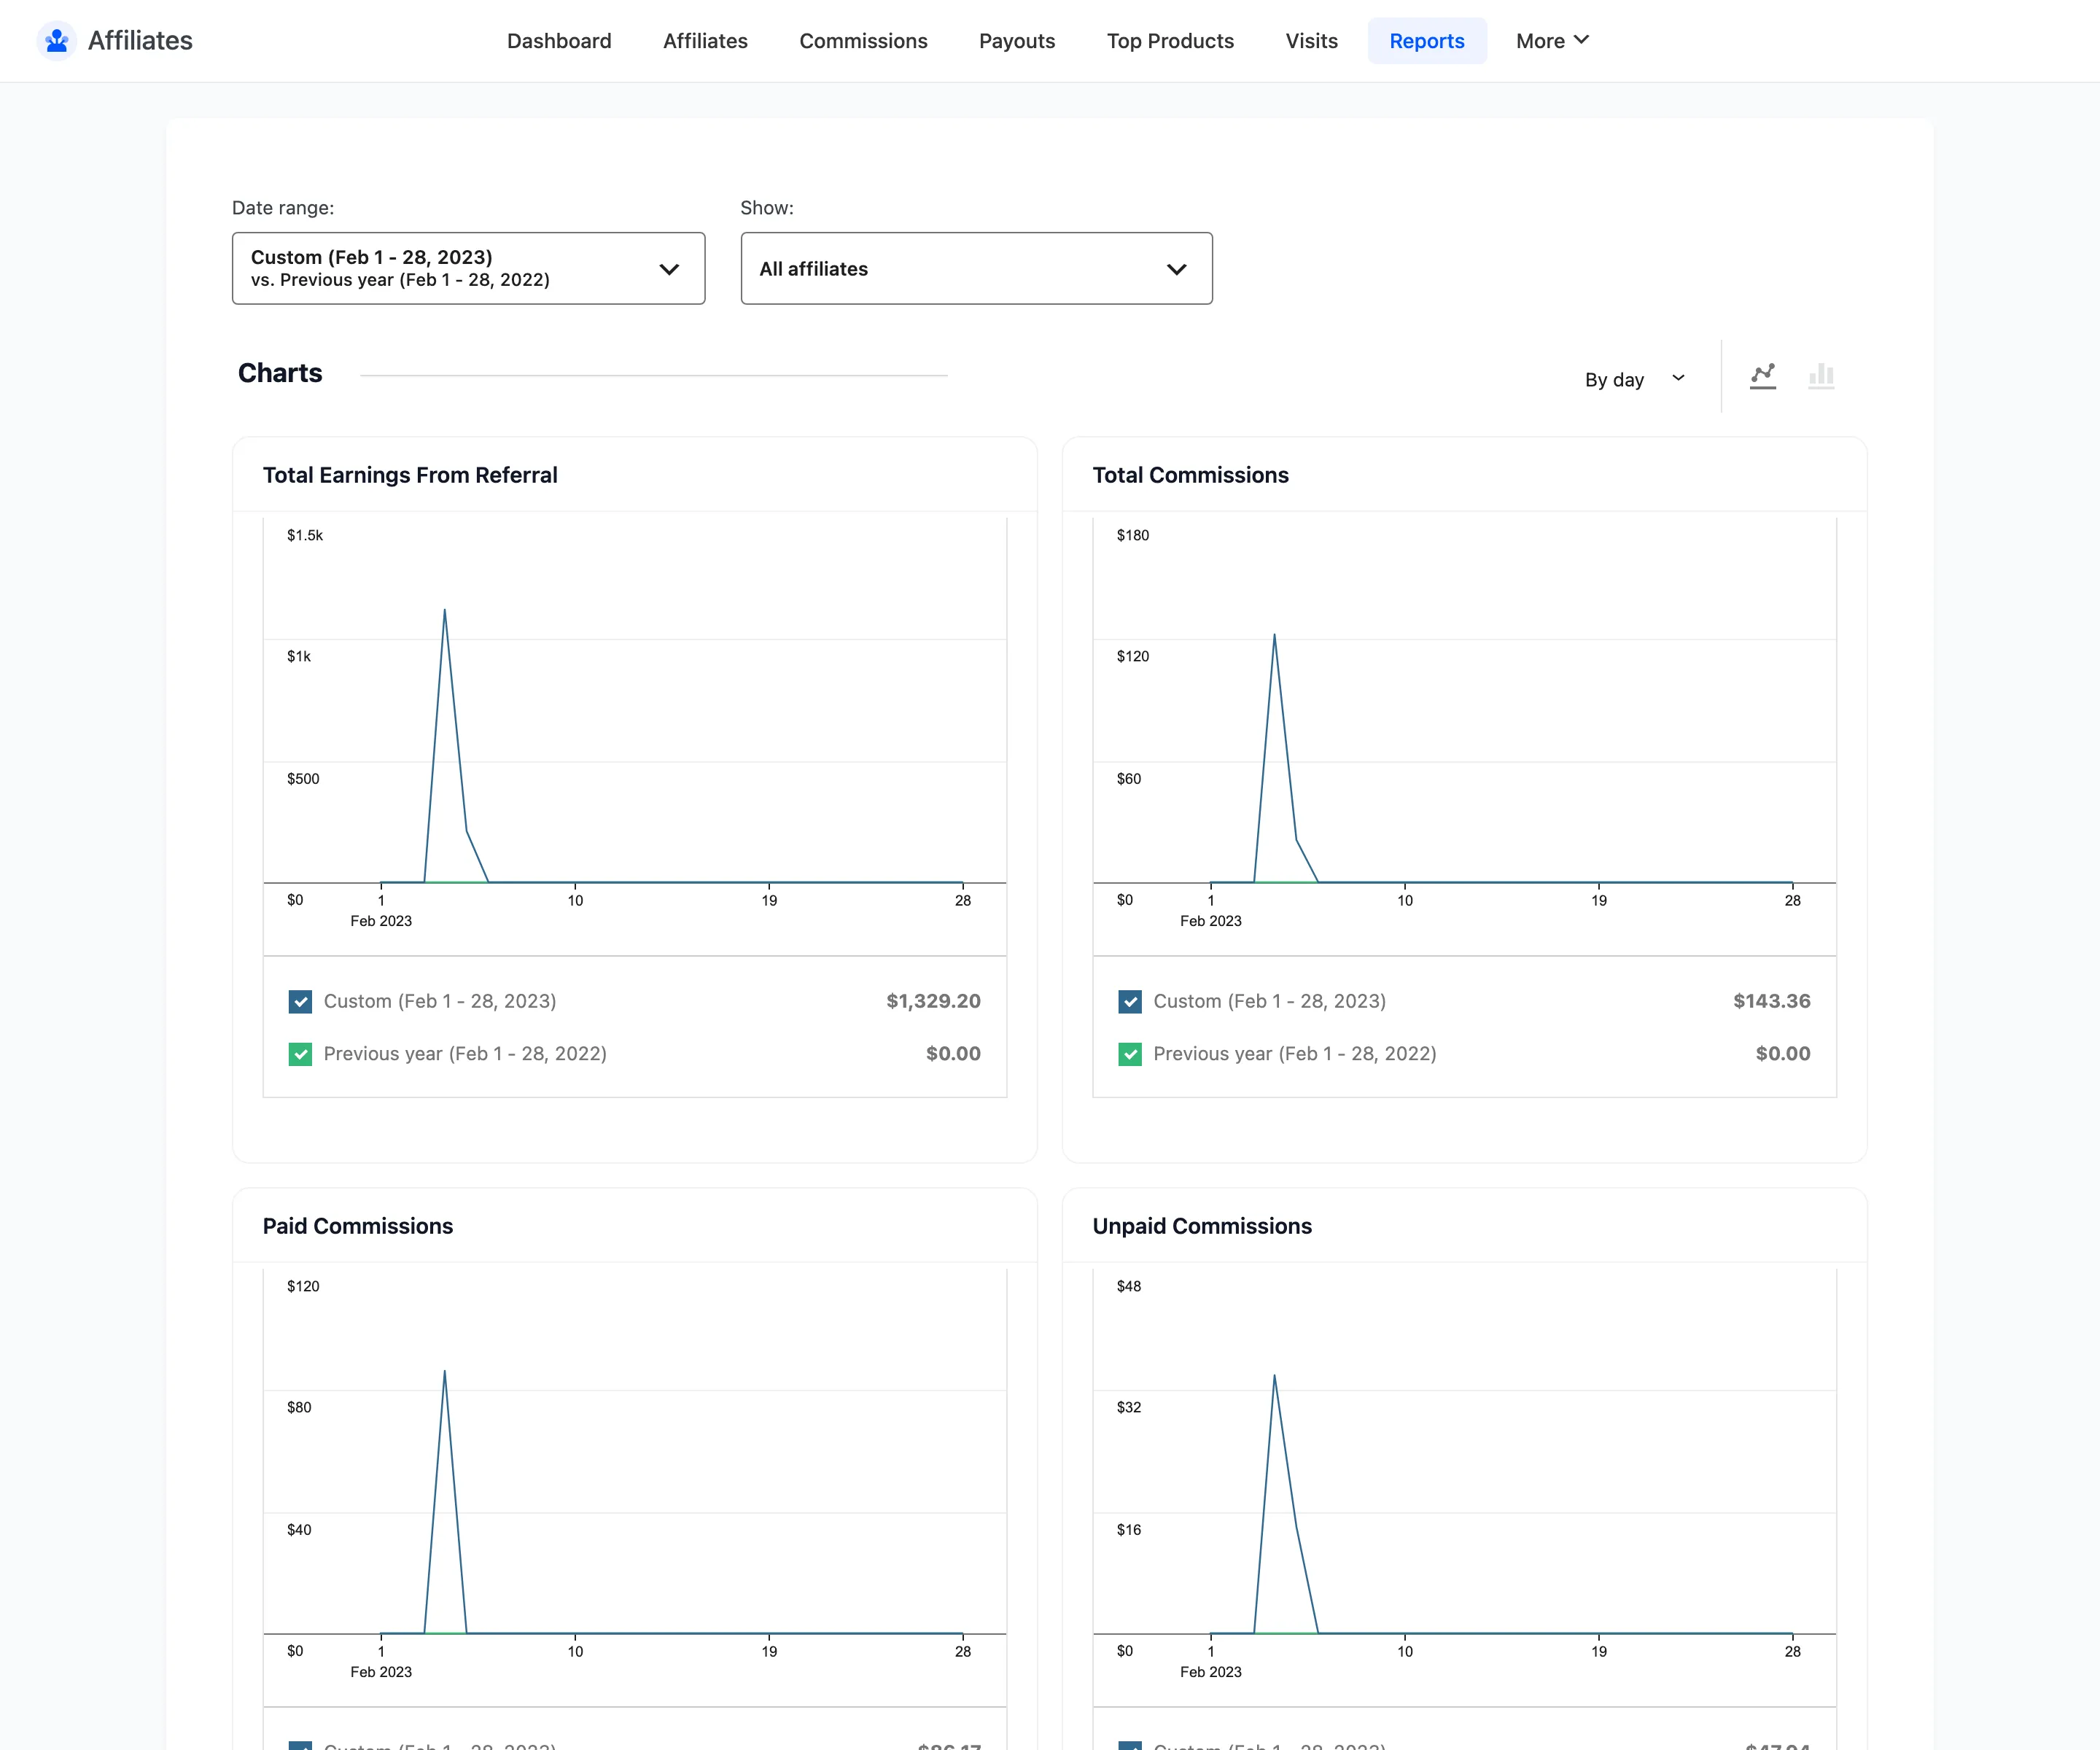
Set the comparison to previous year, not previous period. For a seasonal store last month is never a fair baseline, and comparing December to November produces a false collapse every January.
The lower charts cover traffic rather than money.
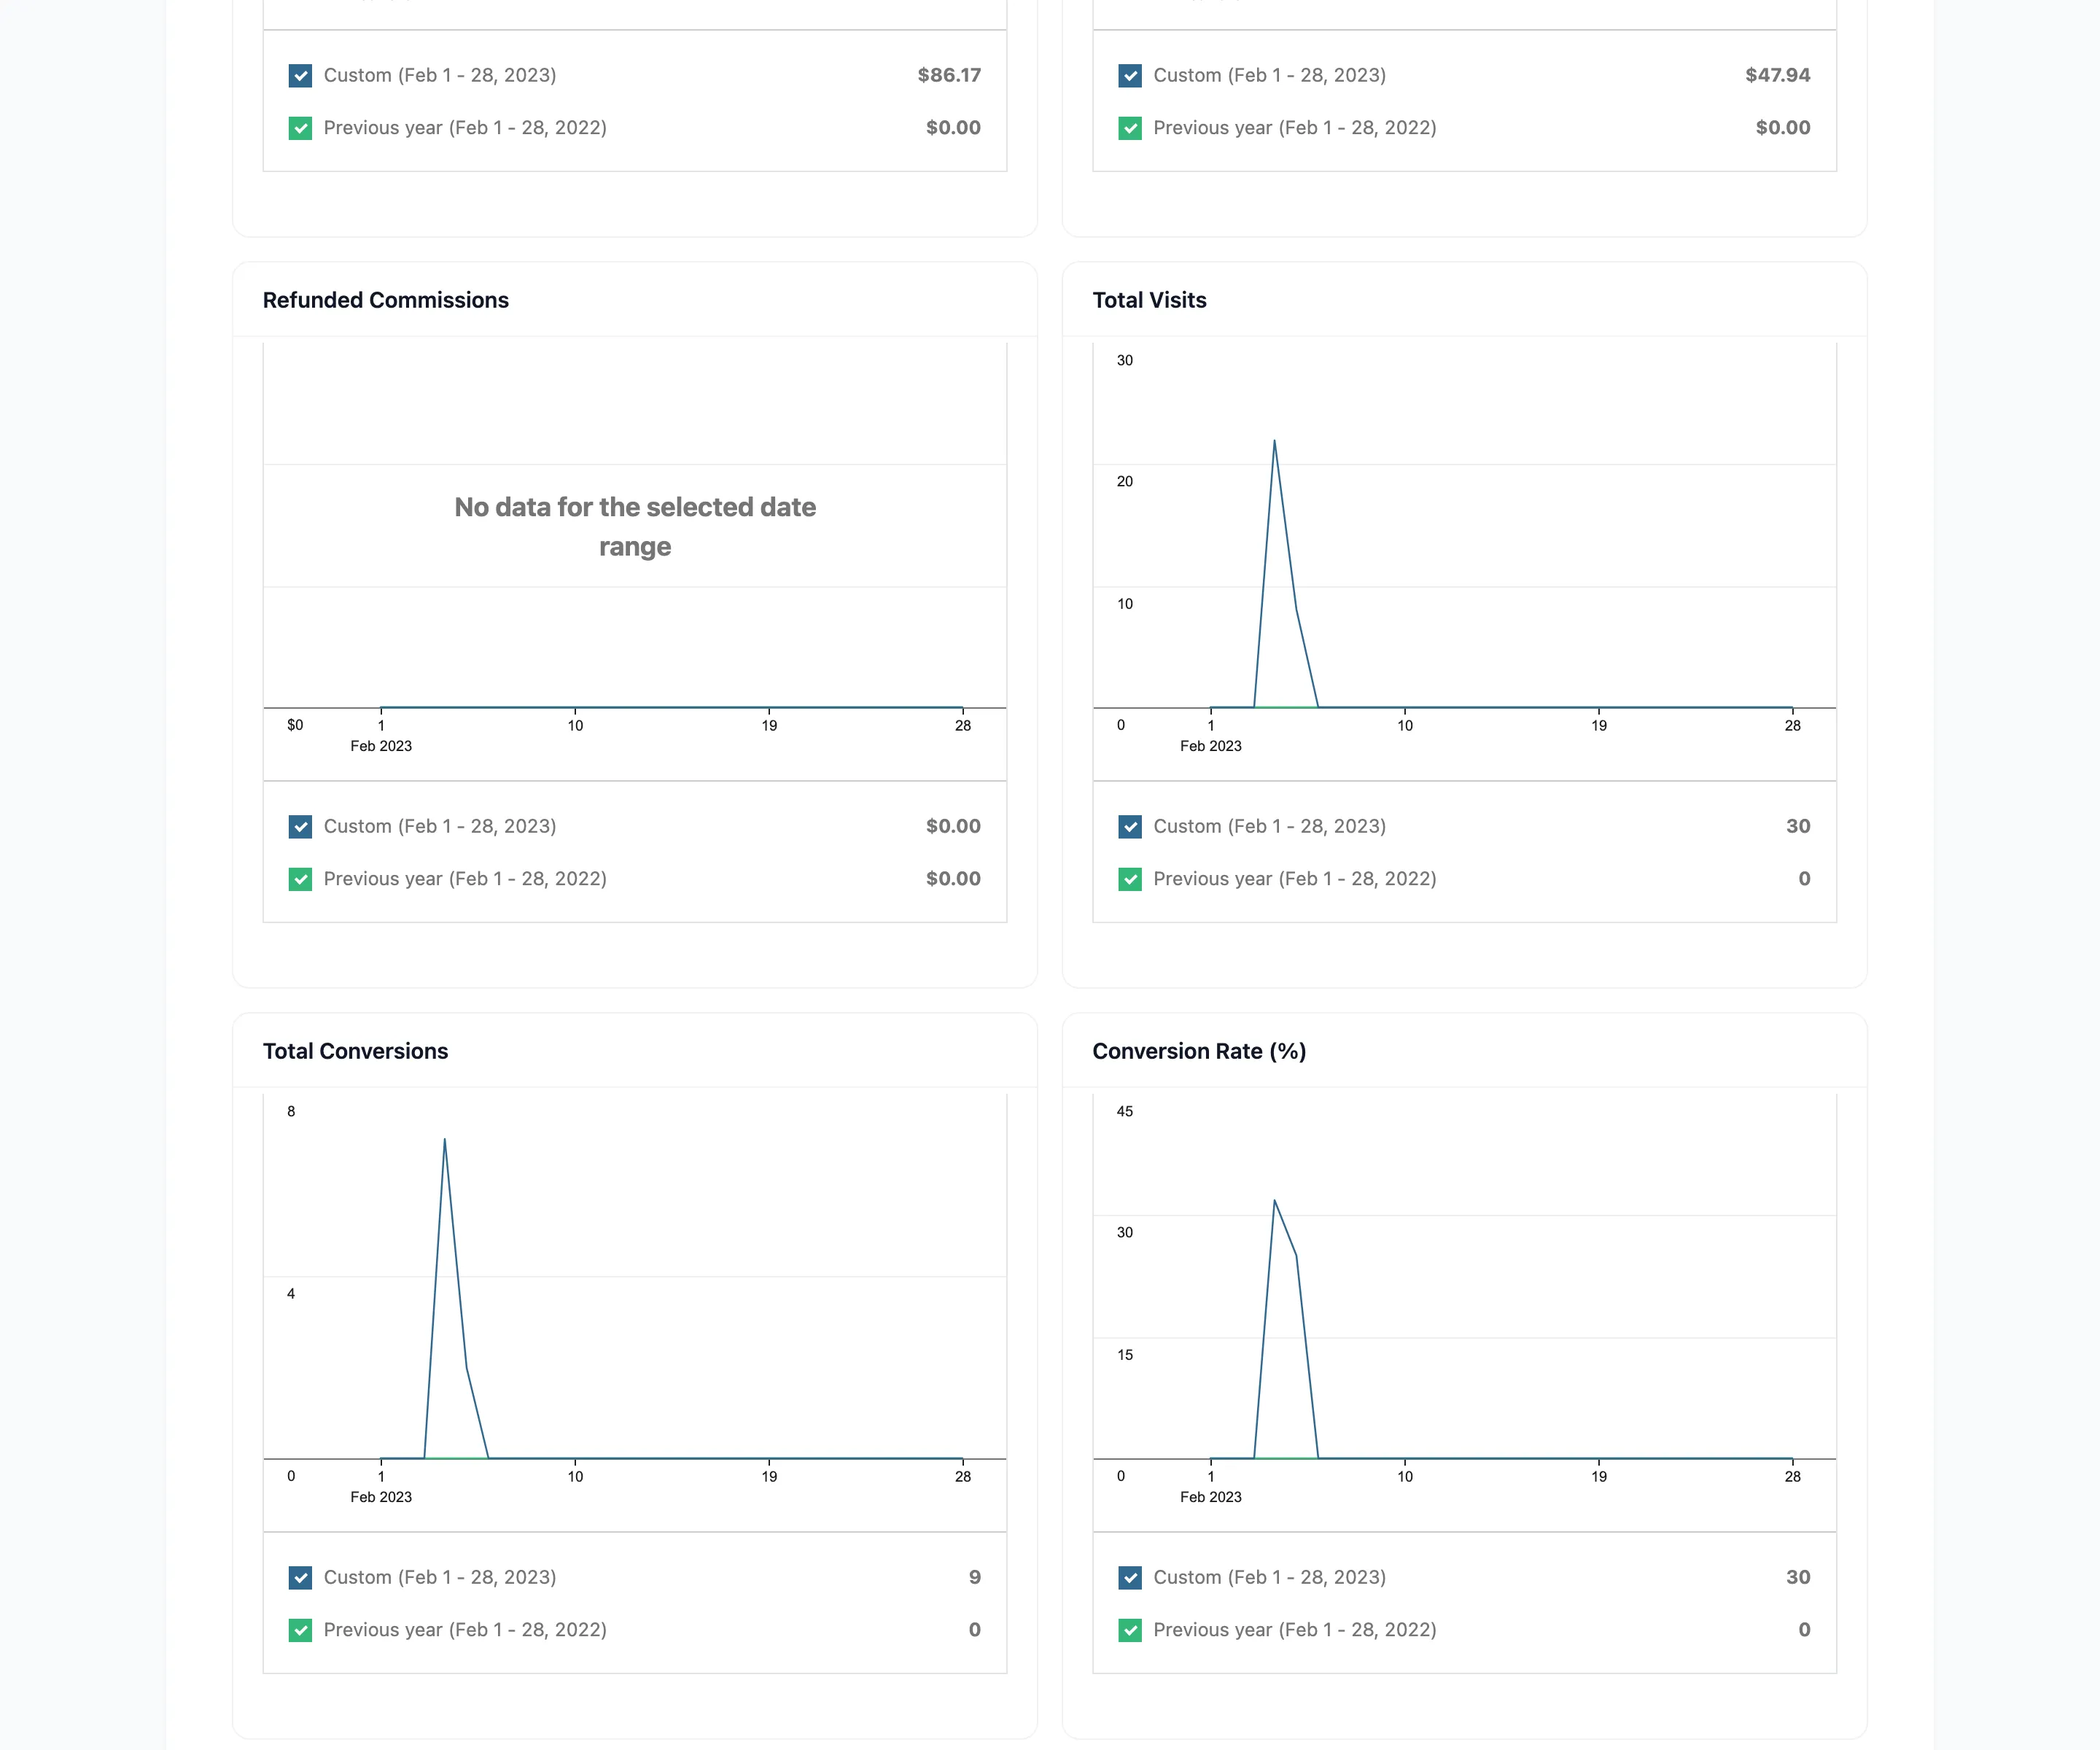
The pairing worth watching is Total Visits against Total Conversions. Their ratio is the conversion rate chart, and a falling rate under rising visits is the earliest sign of low quality traffic.
Use Show to filter to one affiliate. That is what turns a vague sense that a partner has gone quiet into a number you can put in an email.
Step 5: Read Visits for traffic quality
Section titled “Step 5: Read Visits for traffic quality”Go to Affiliates → Visits and use the filter links above the table.
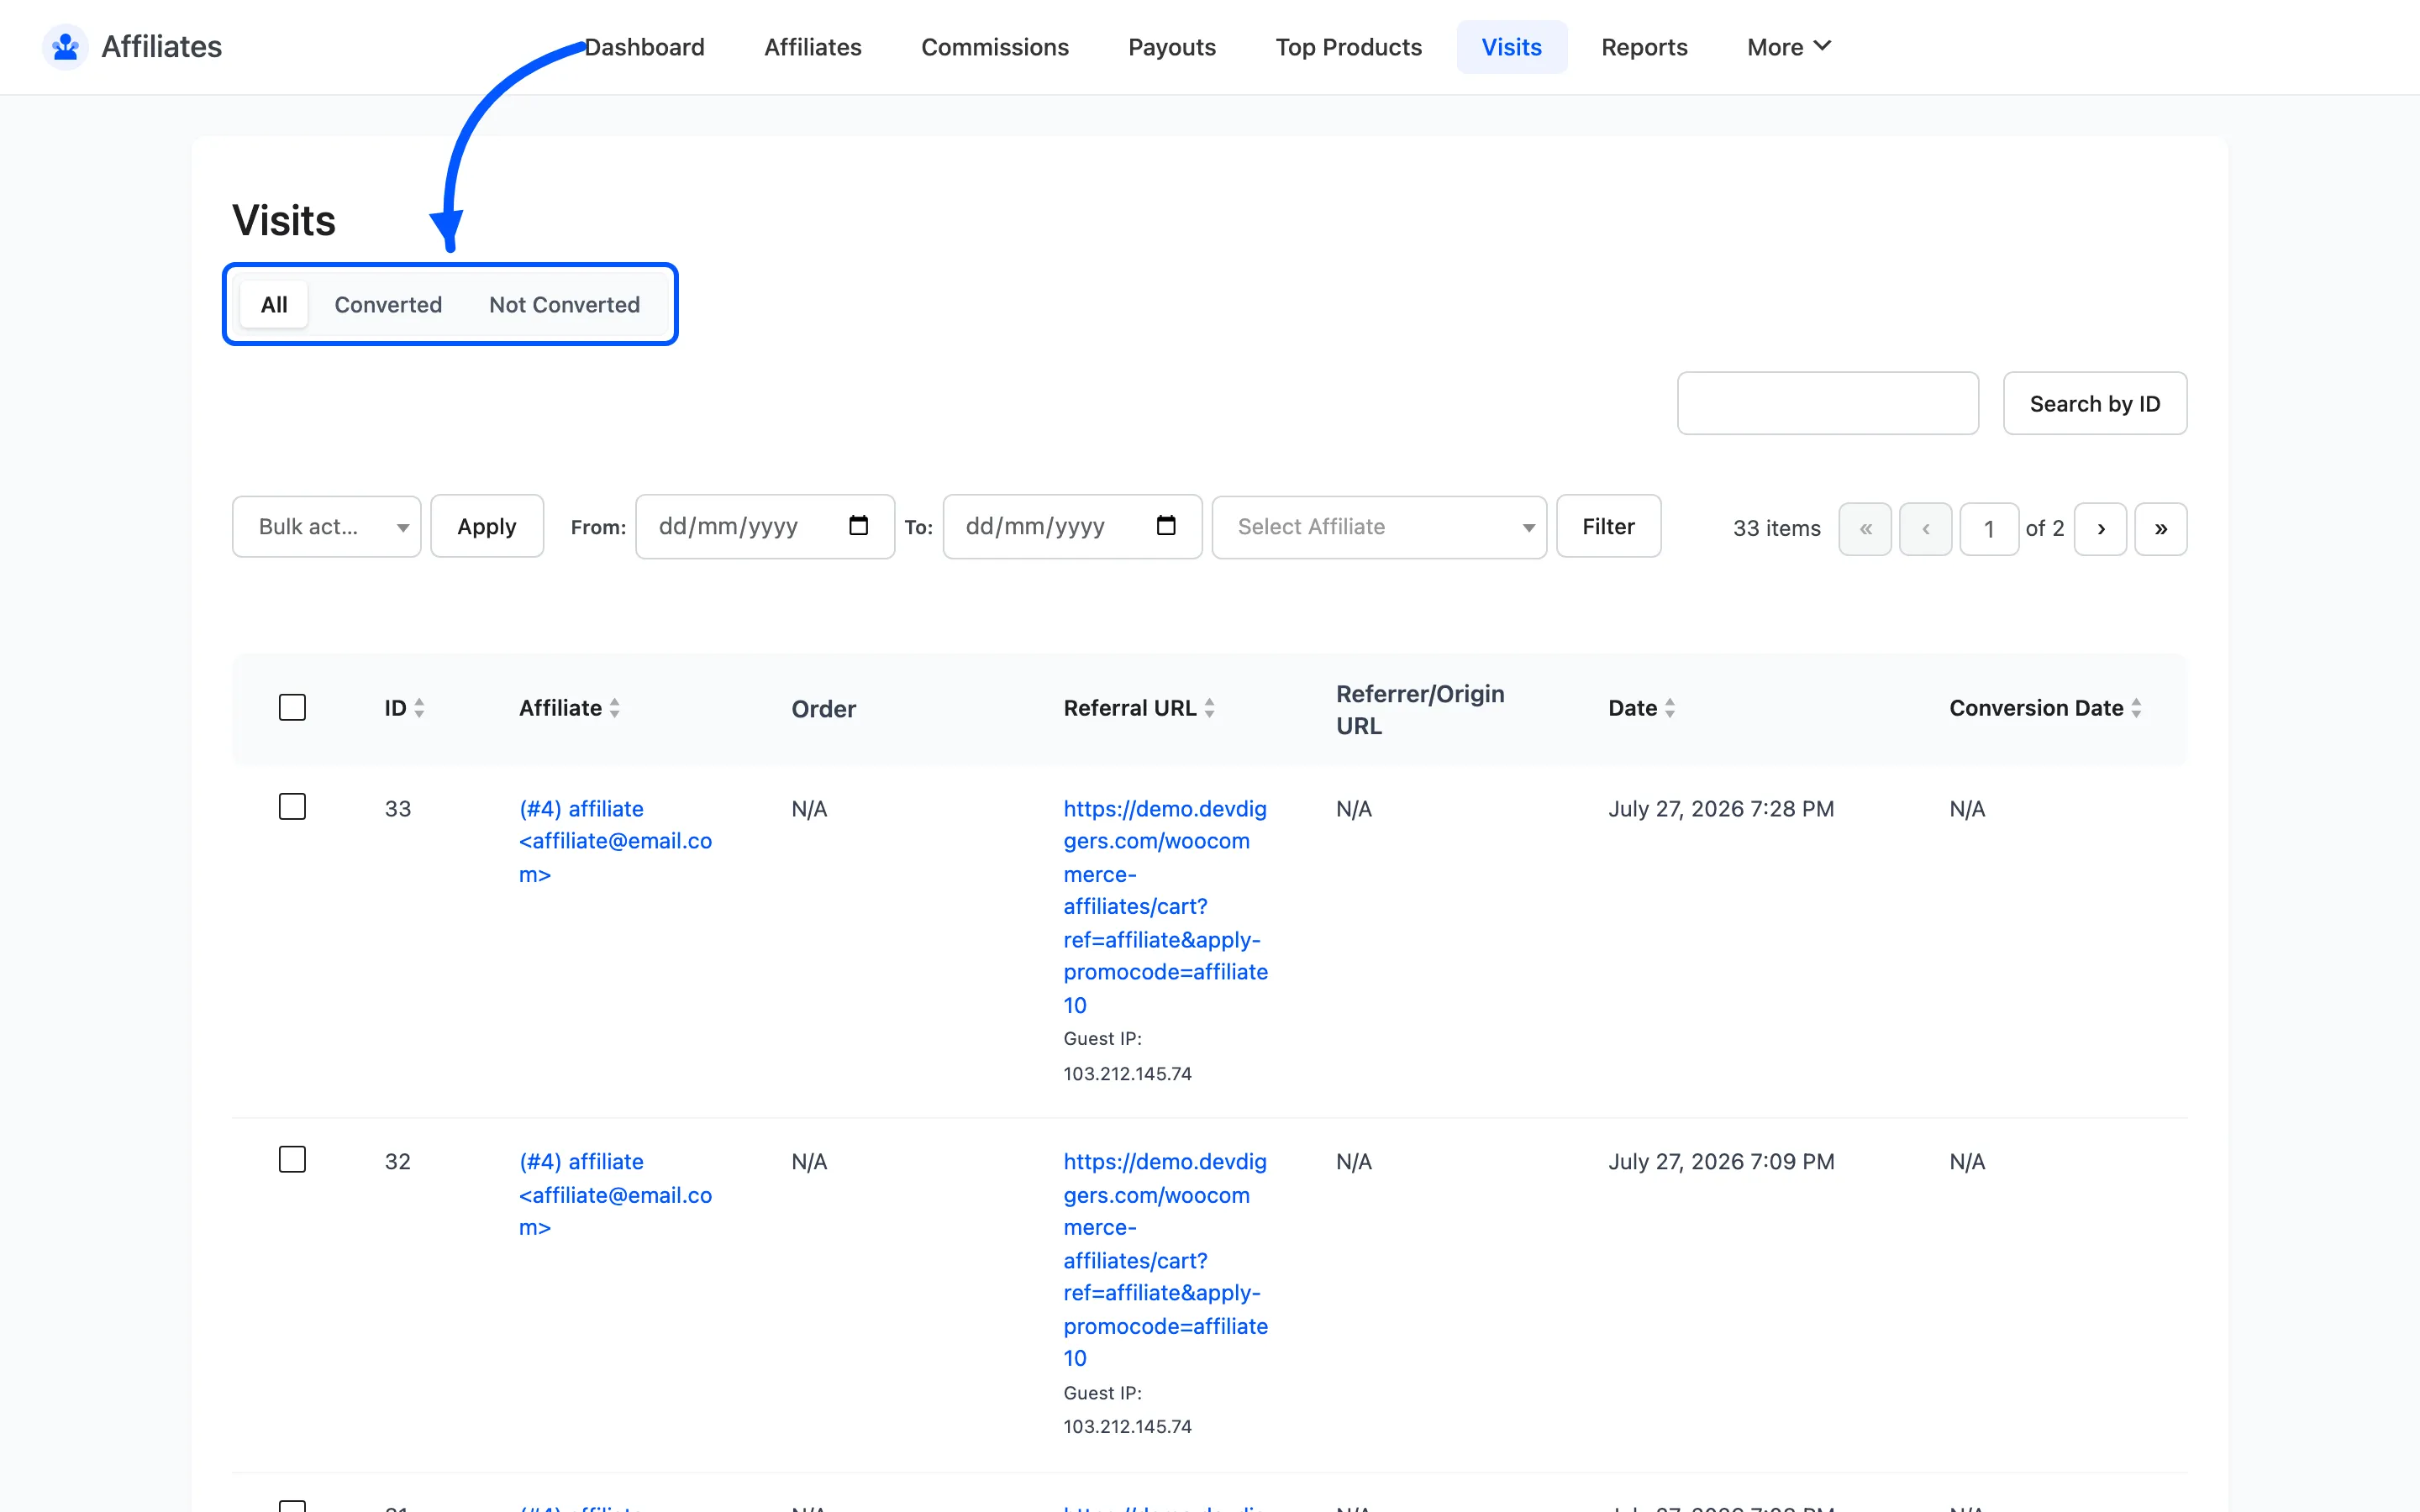
Not Converted is the useful one. A run of visits to the same landing page with no orders is a page problem, not an affiliate problem. No amount of pushing that partner will fix it.
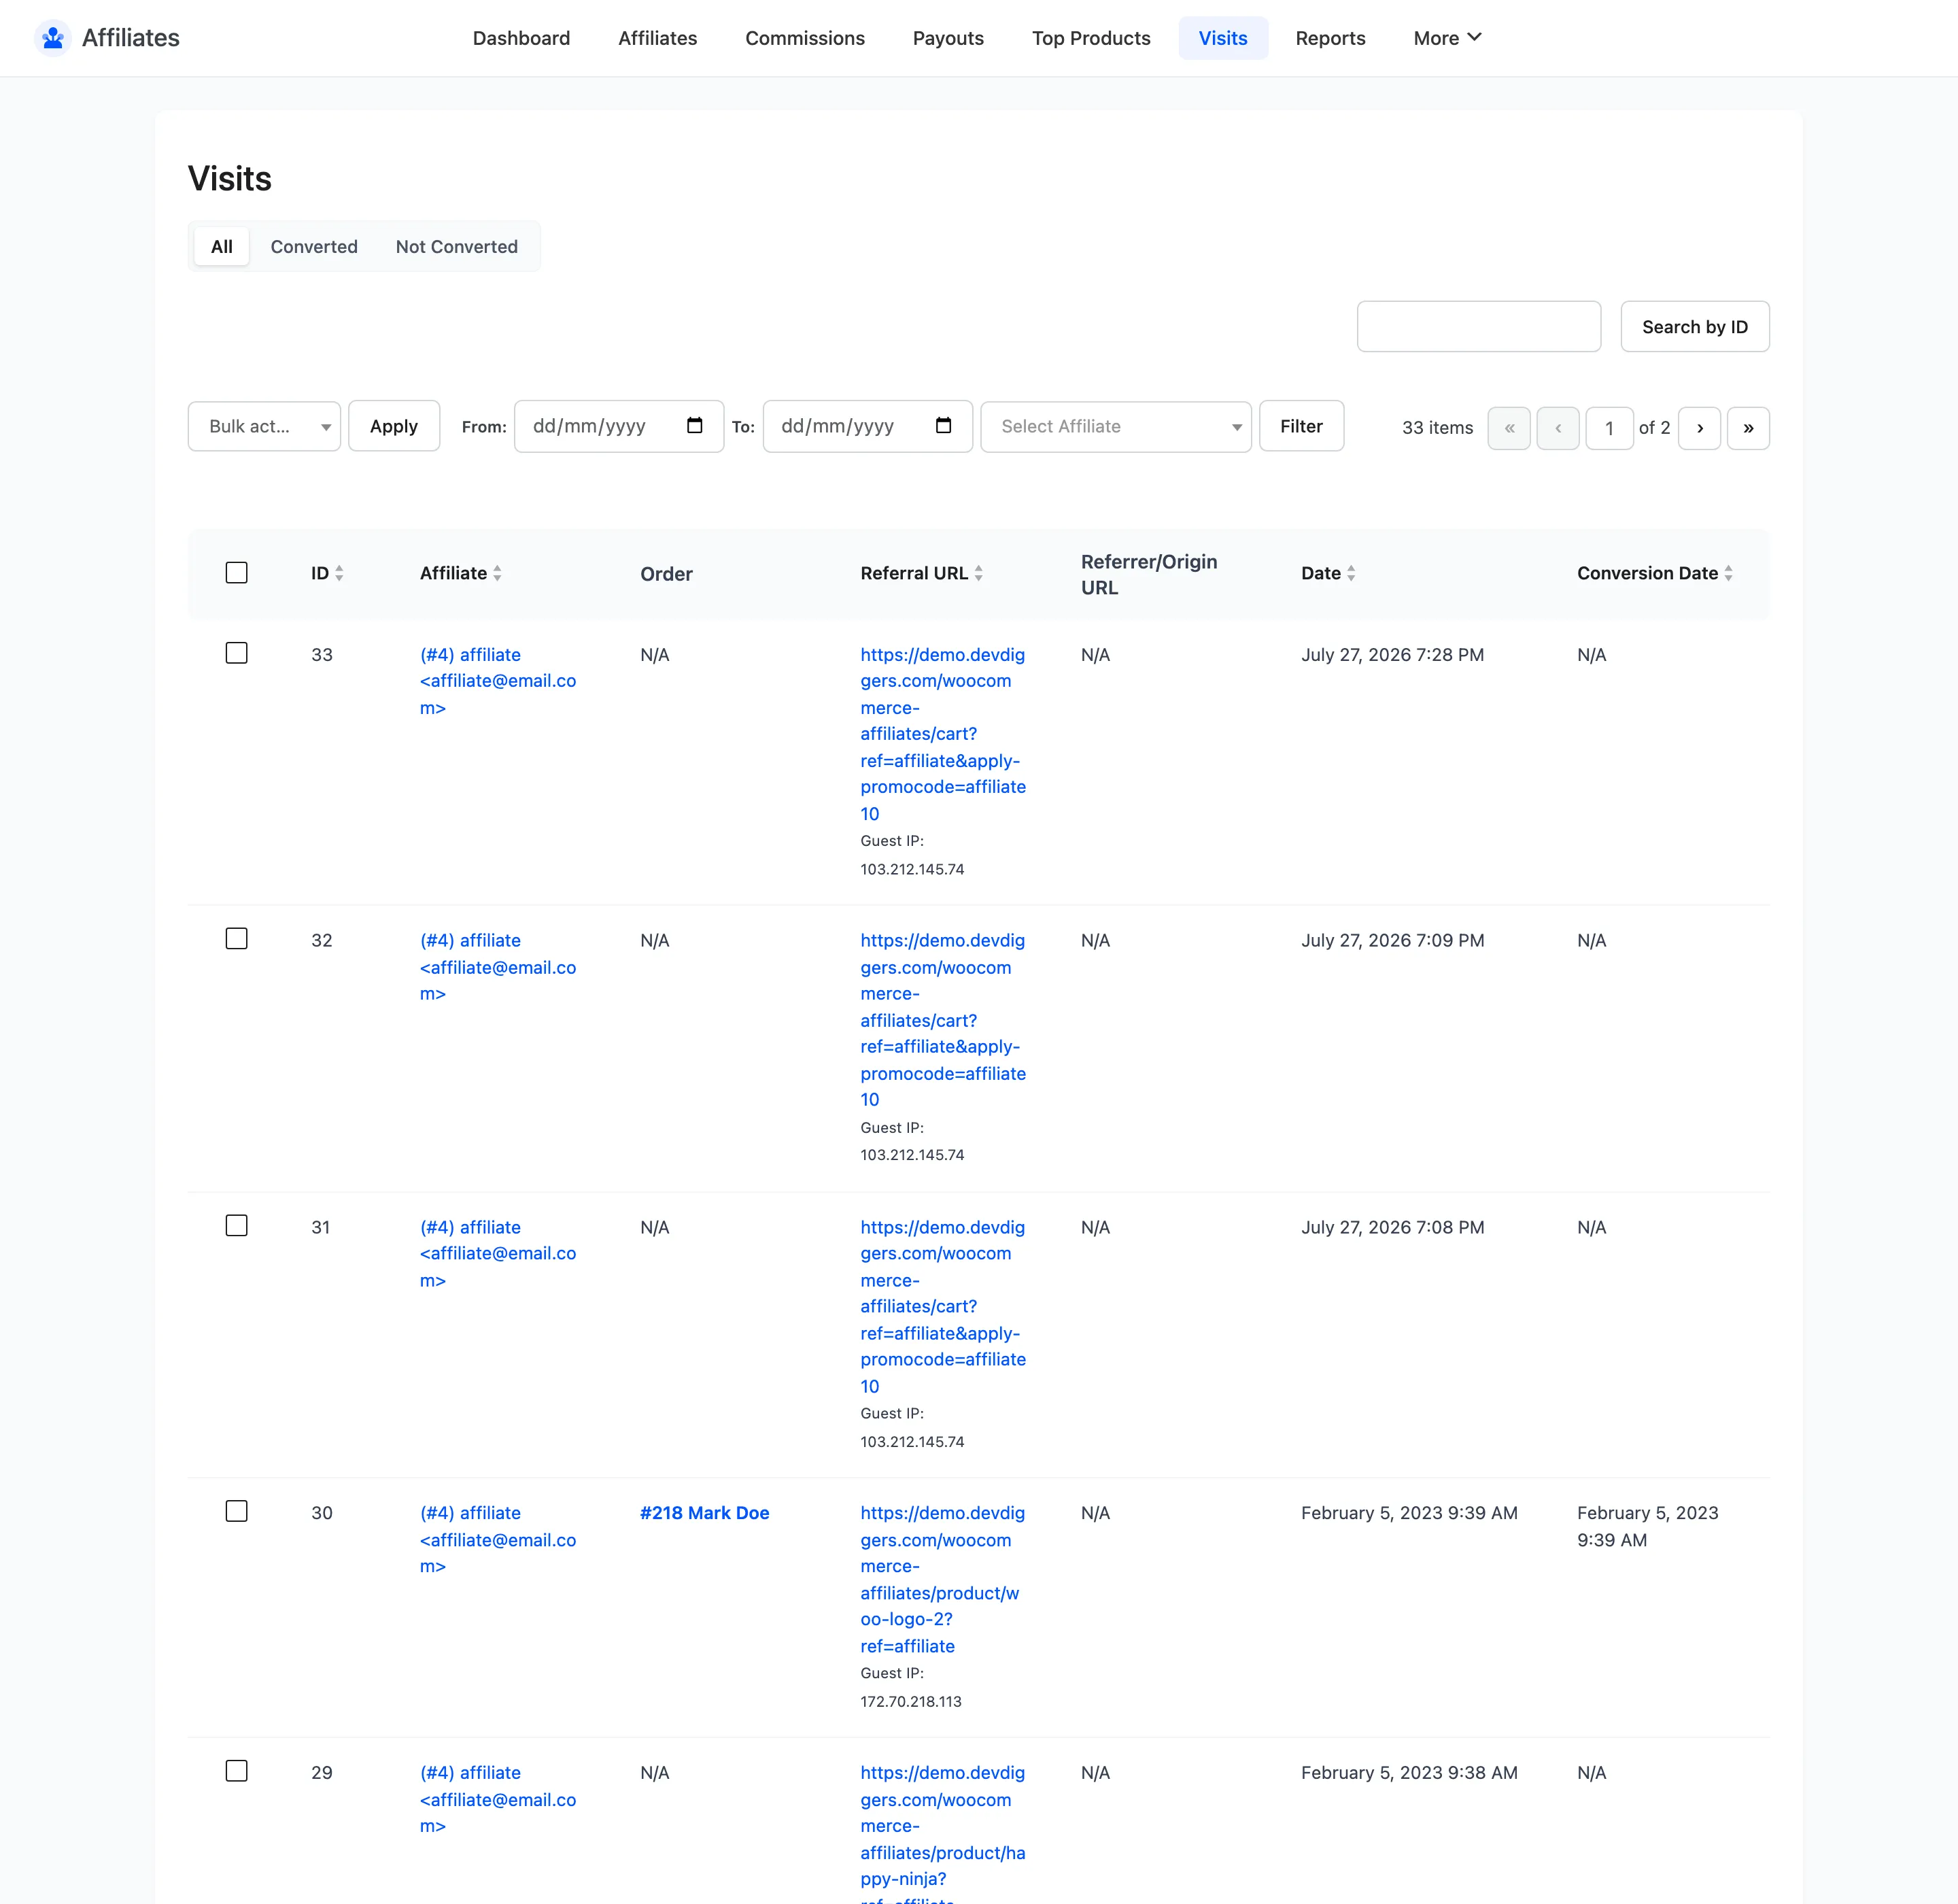
The landing URL column is what makes this actionable. It tells you exactly which page to look at.
Step 6: Read Top Products for what to promote
Section titled “Step 6: Read Top Products for what to promote”Go to Affiliates → Top Products.
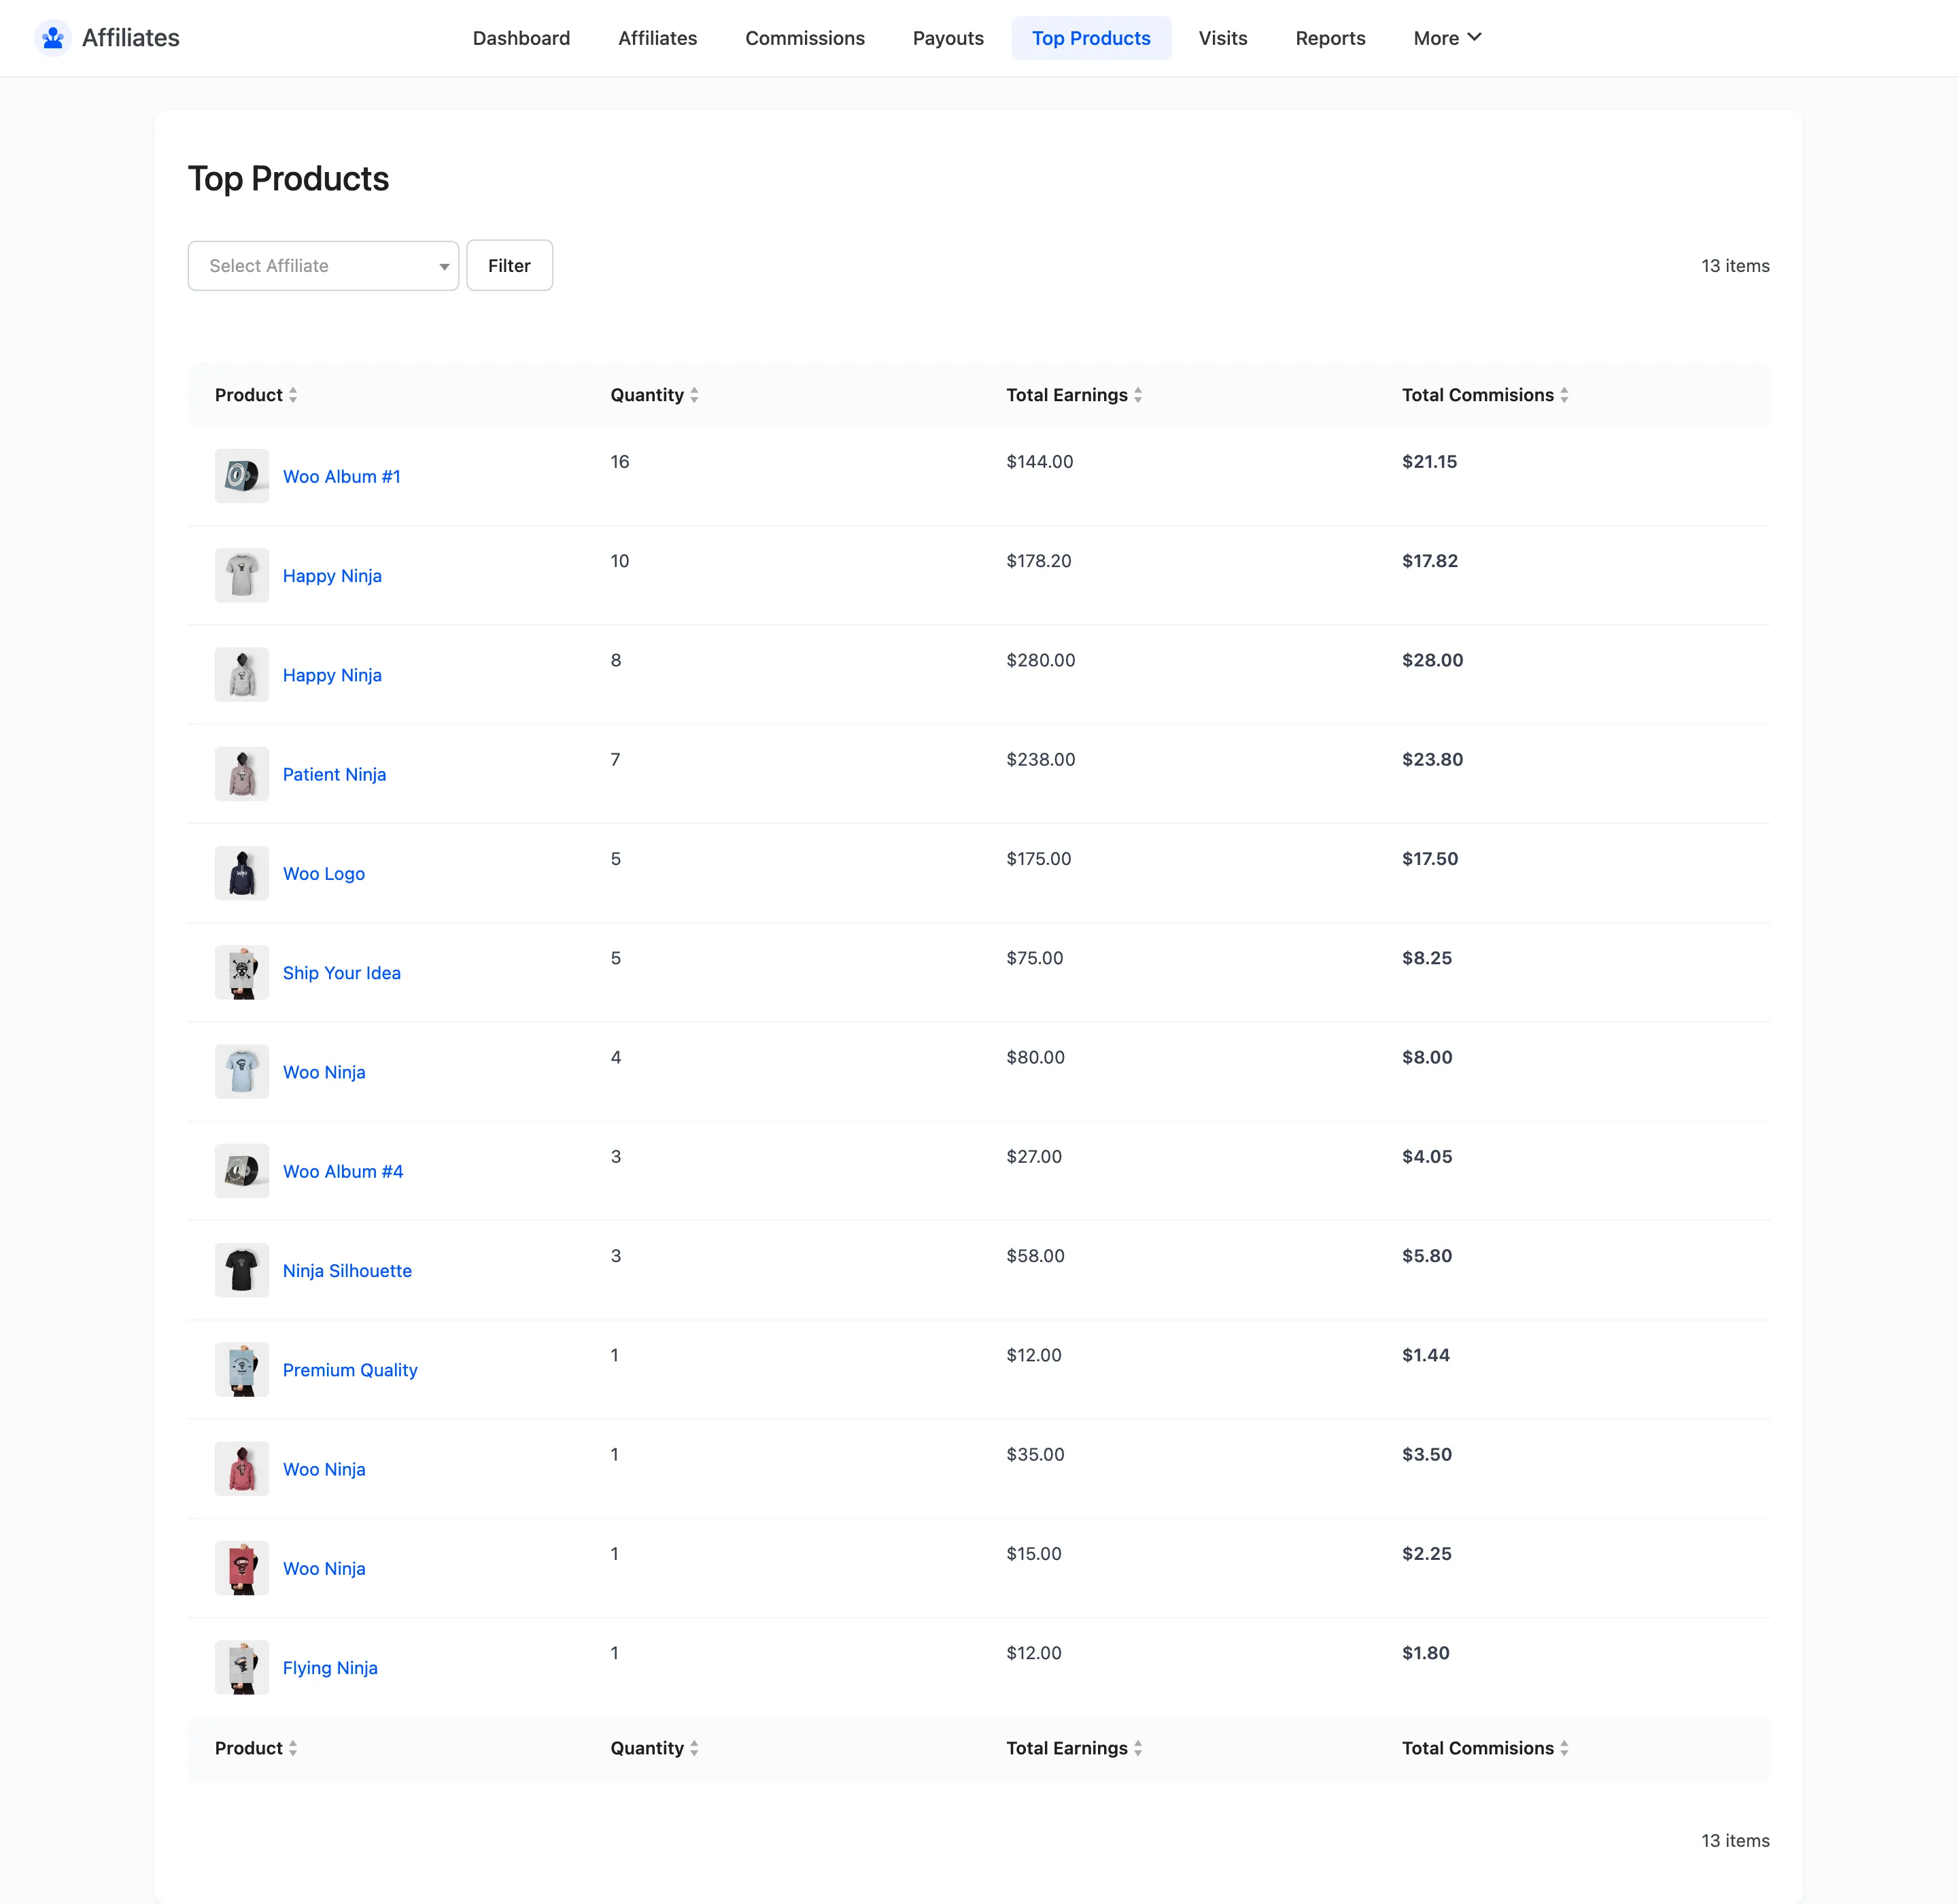
This ranks products by what affiliates actually sold, which is rarely what you assumed they would sell. Send the list to your best partners and let it choose their next post for them.
It also feeds your rate decisions. A product that sells well through affiliates and carries margin is a candidate for a higher rate through a commission rule.
Step 7: Turn it into three decisions
Section titled “Step 7: Turn it into three decisions”Everything above collapses into three actions.
- Who to reward: Filter Reports to each affiliate and find the ones whose conversion rate beats the rest. Raise their rate on their detail screen.
- Who to help: Find affiliates with visits and no conversions. Send them the Top Products list and a creative.
- What to stop. Watch Refunded Commissions. Orders that arrive and then return cost more than orders that never arrive.
Where to go next
Section titled “Where to go next”- Dashboard Overview for every card and widget on the dashboard.
- Reports for the eight metrics in detail.
- How to Set Commission Rates to act on what you find.