

Dashboard Overview
The dashboard is the first screen under DevDiggers Plugins → Affiliates. It answers one question: is the program making money, and who is making it.
Open the dashboard
Section titled “Open the dashboard”Go to DevDiggers Plugins → Affiliates. Dashboard is the first tab.
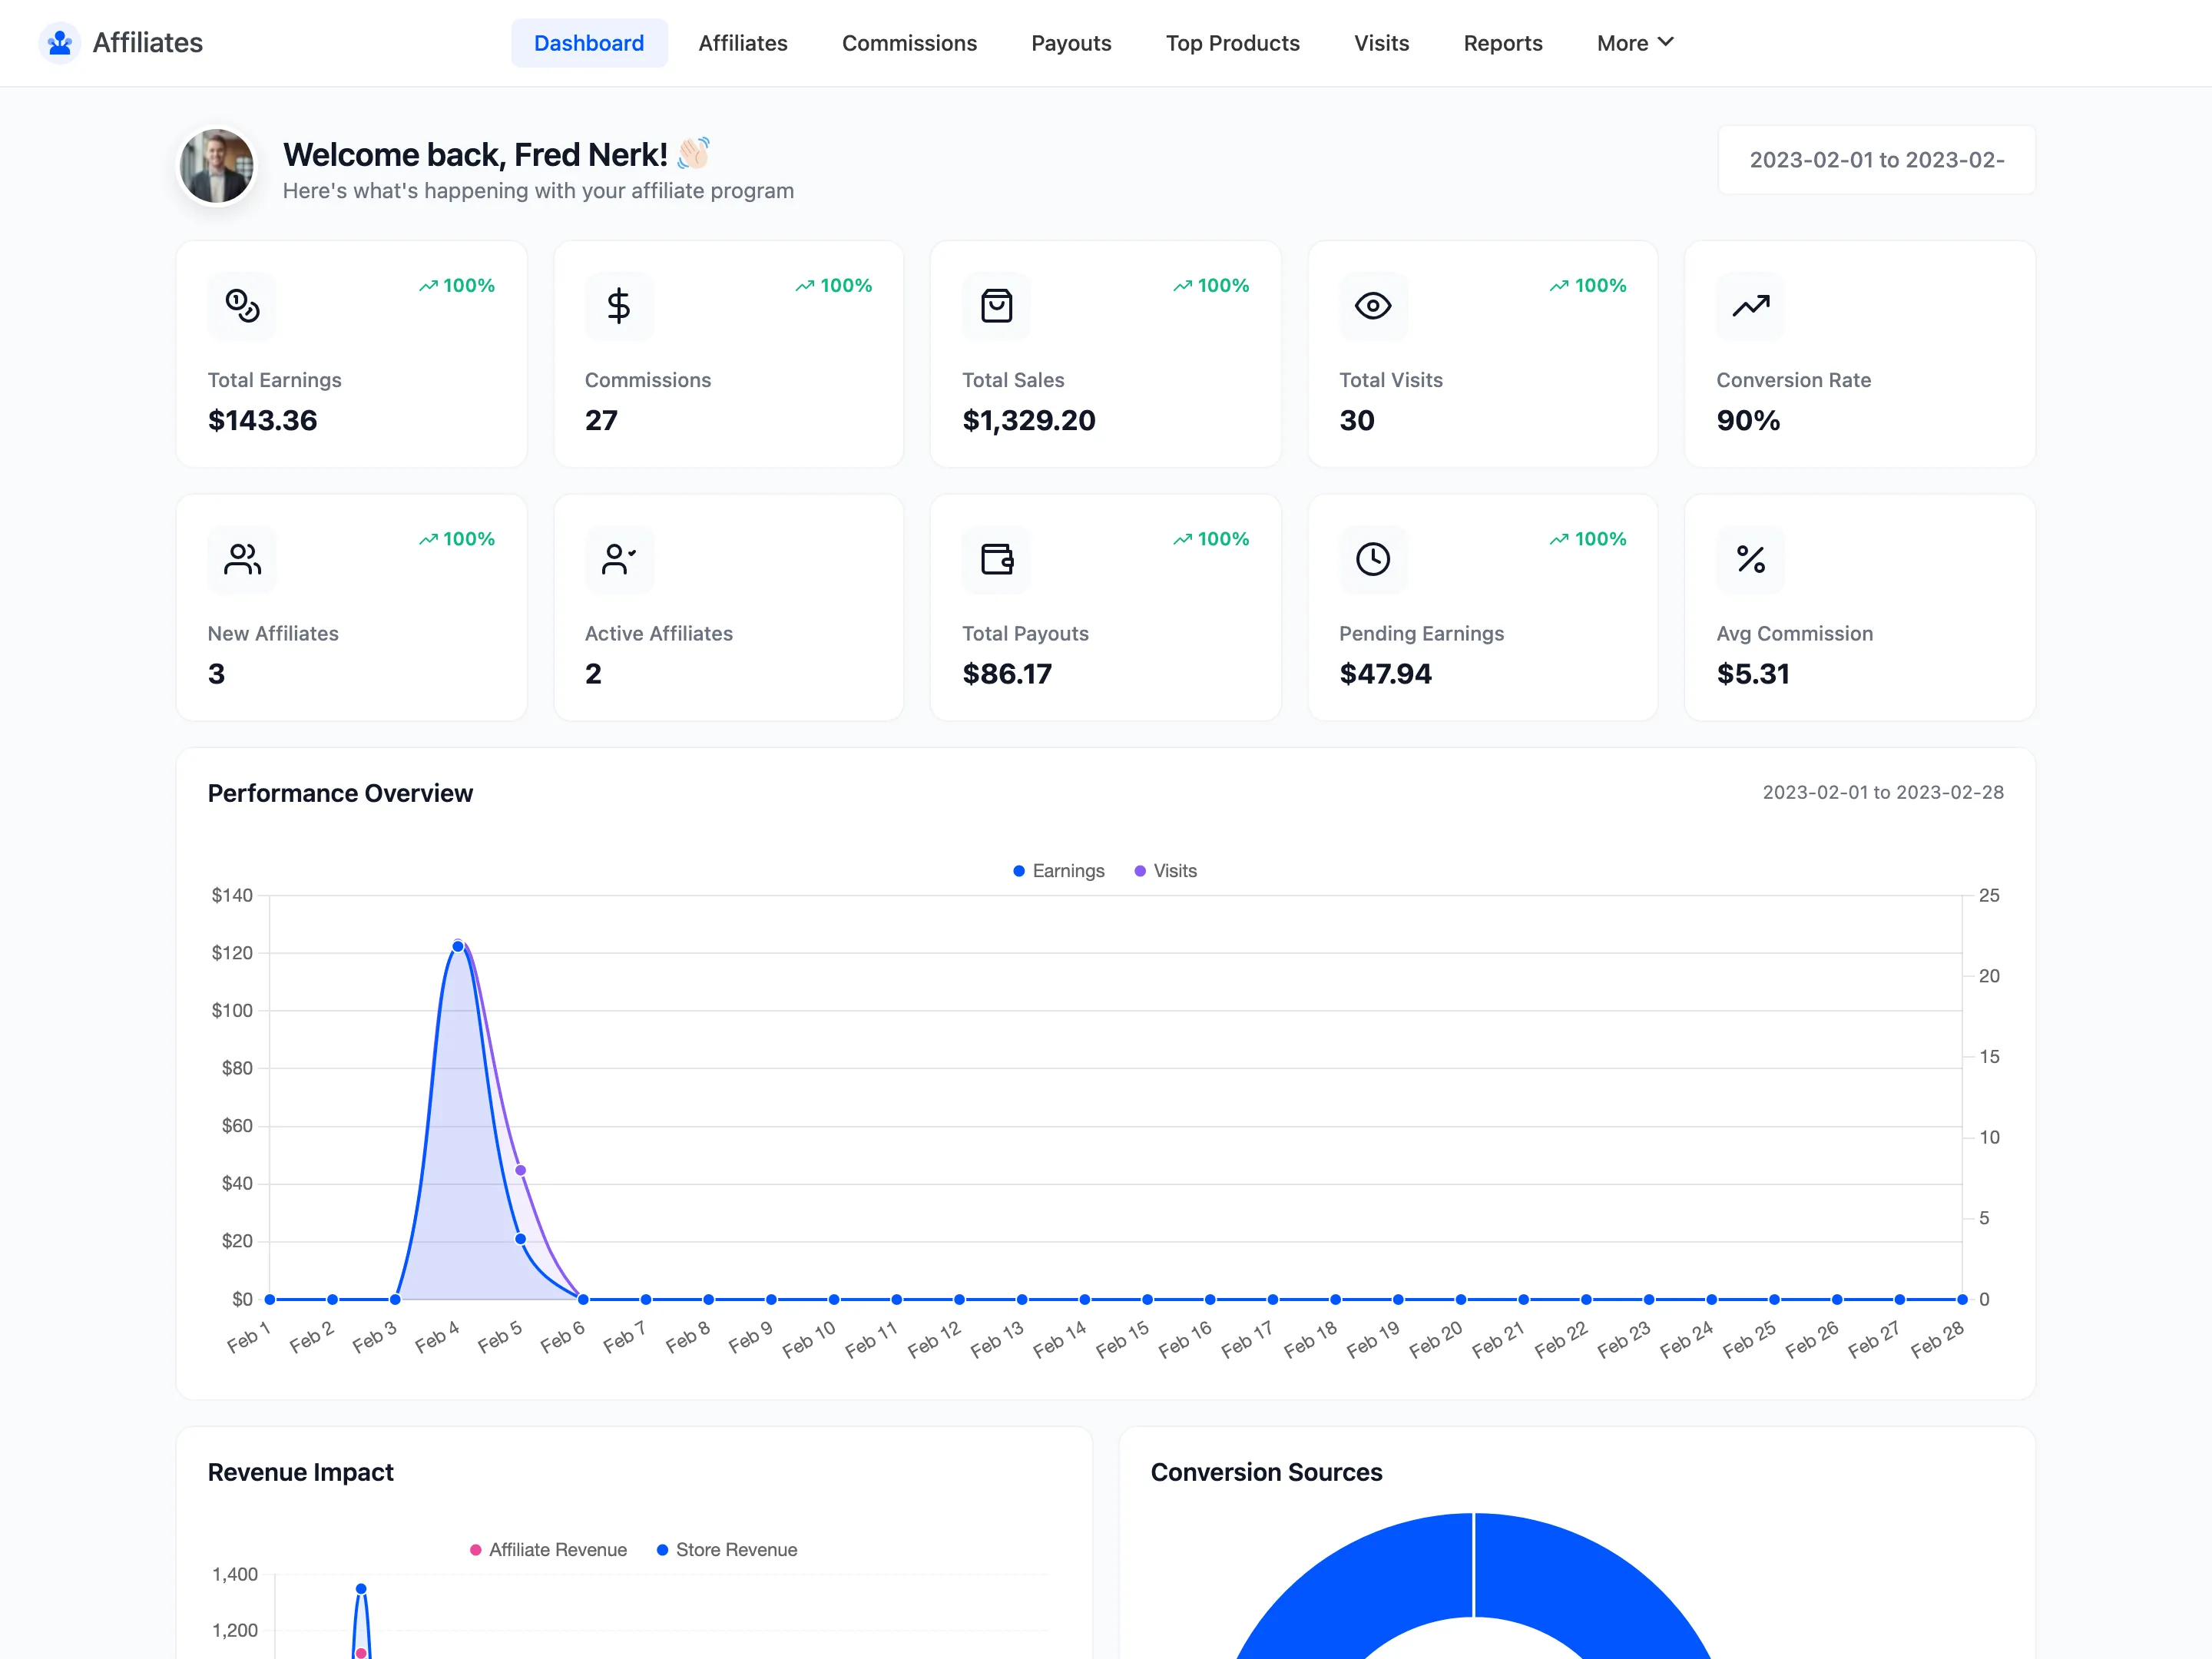
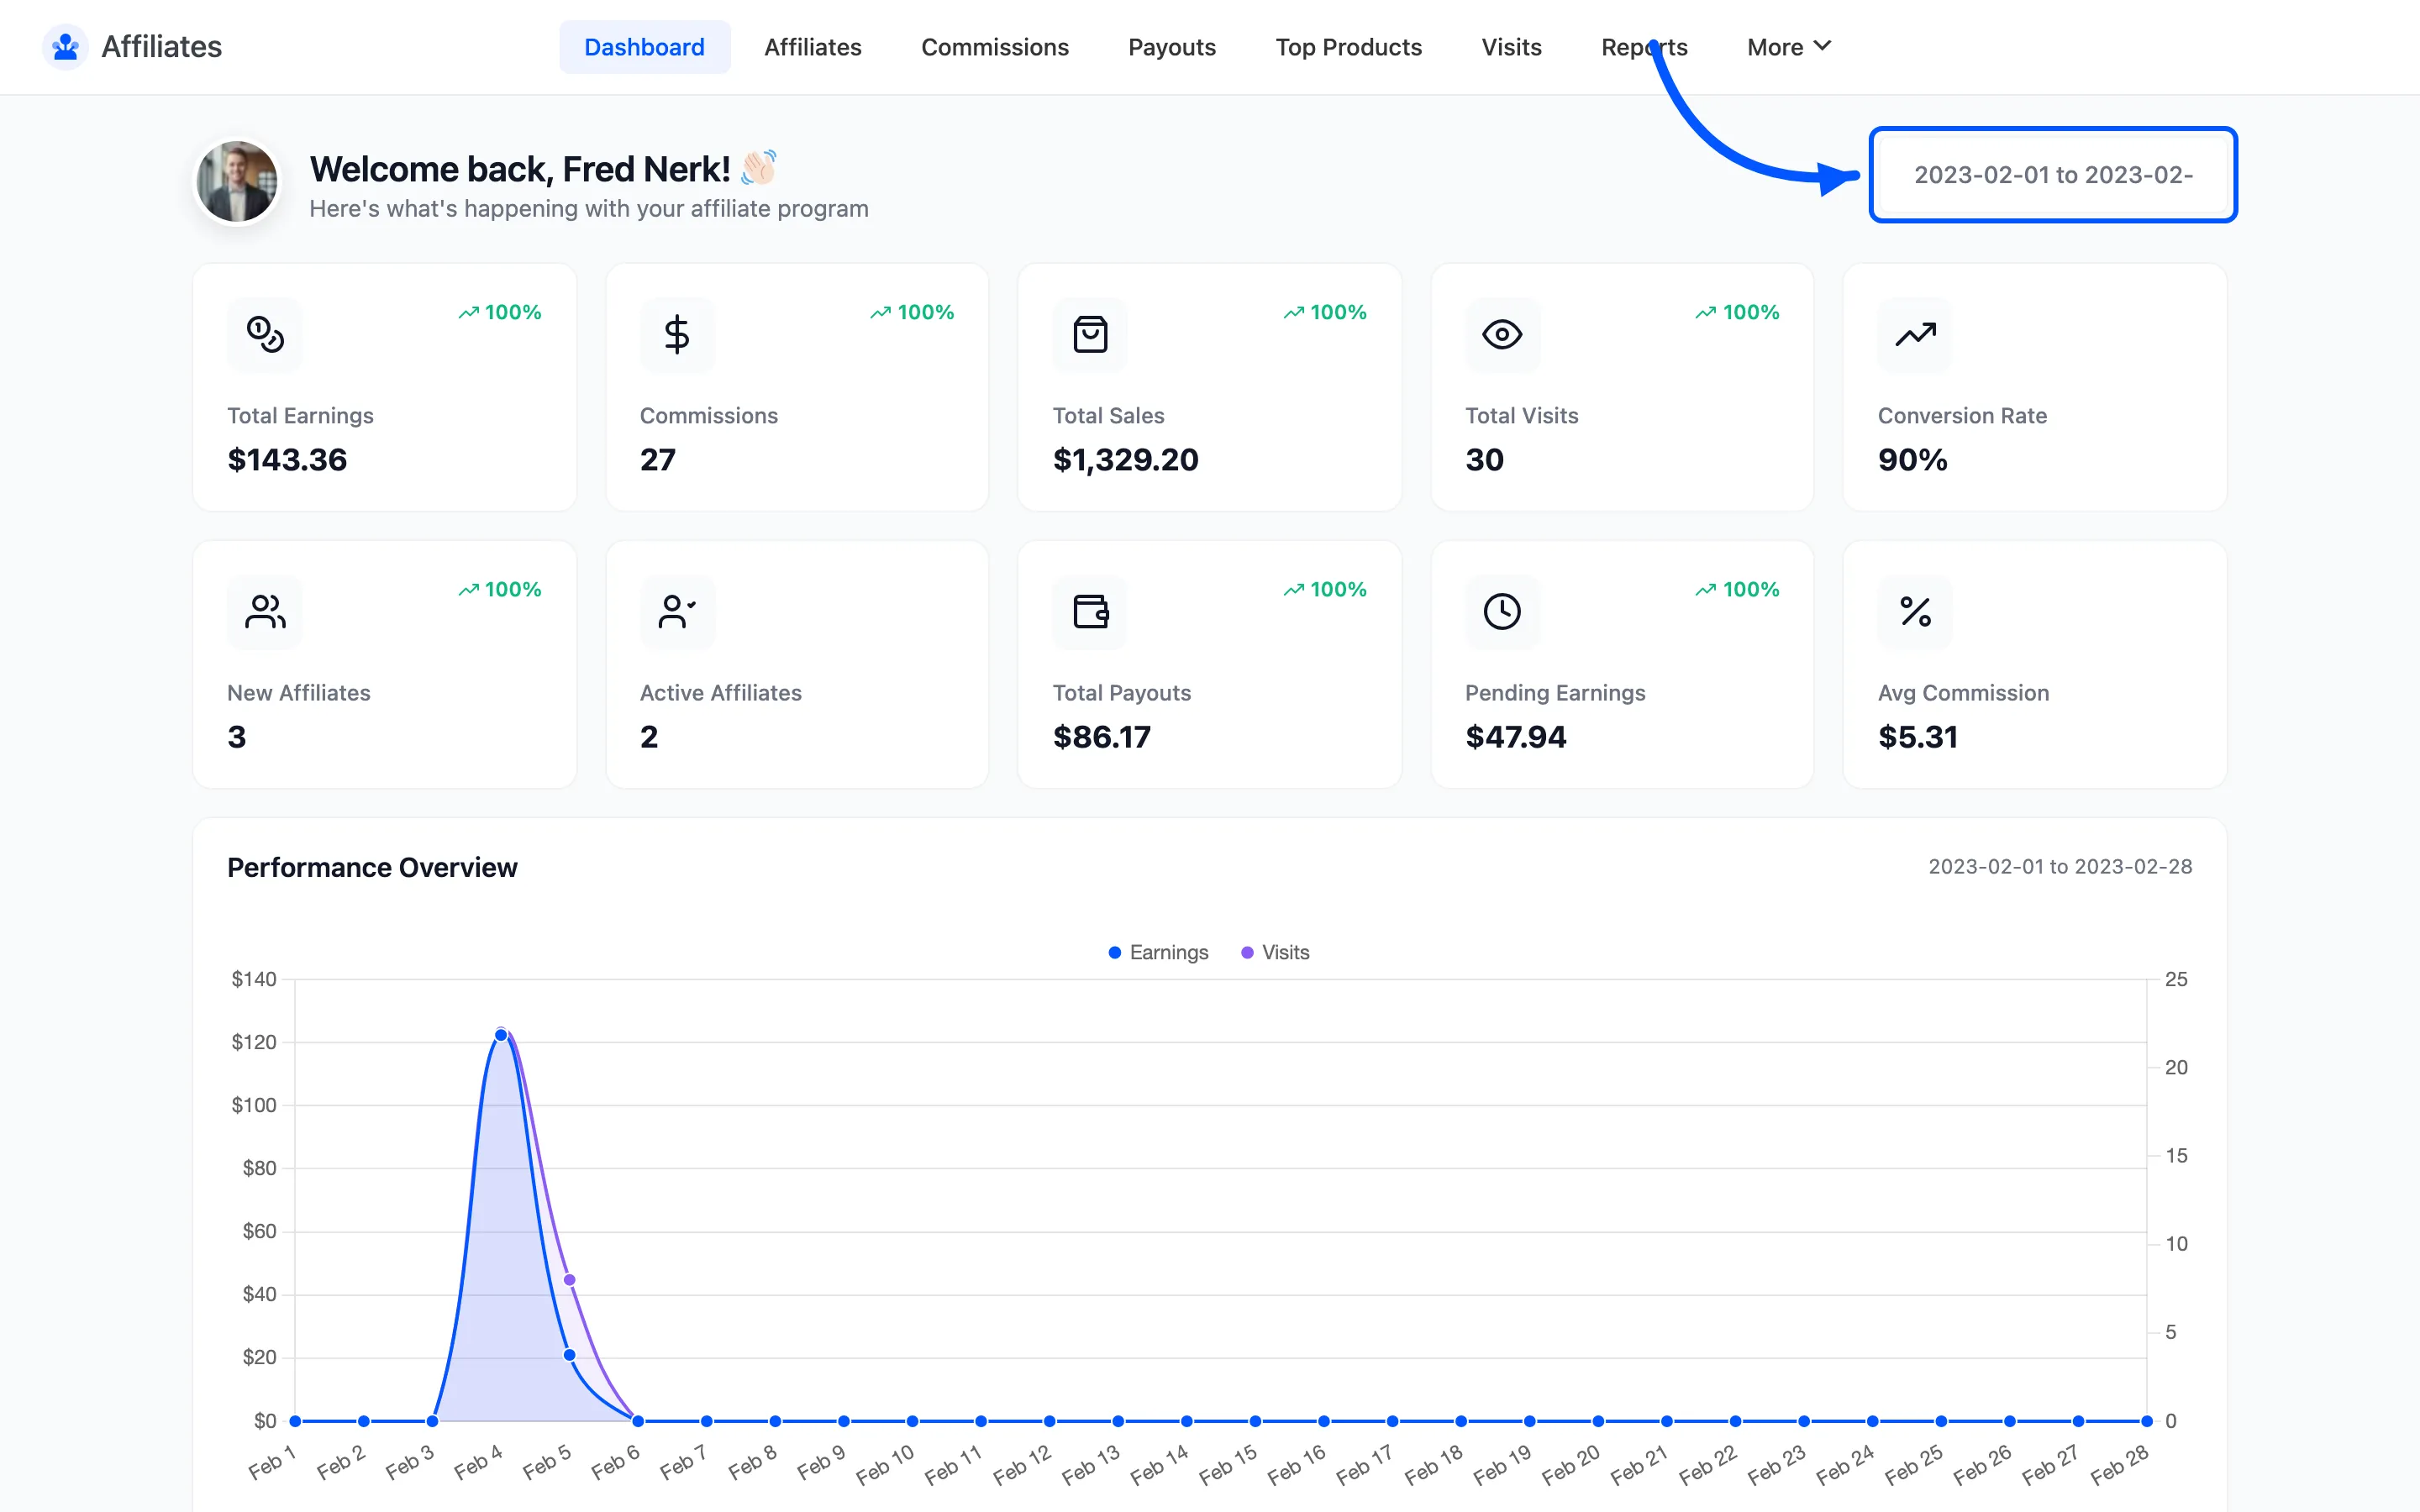
The date selector at the top right sets the period for every number on the screen. It defaults to This Month, which is why a freshly installed store shows zeros even when older data exists.
It offers ten presets plus a custom range:
- Today, This Week, Last Week, This Month, Last Month
- Last 3 Months, Last 6 Months, Year to Date, Last Year, All Time
The summary cards
Section titled “The summary cards”Ten cards run across the top. They split into three groups.
- Total Earnings is the commission your affiliates earned in the period.
- Commissions is how many commission rows were created. One order with three line items creates three rows.
- Total Sales is the order value those commissions came from, so you can compare what you paid against what it brought in.
- Total Payouts is what you actually paid out.
- Pending Earnings is commission that is earned but not yet paid.
- Avg Commission is the average value of a single commission row.
Traffic
Section titled “Traffic”- Total Visits is how many referral clicks were logged.
- Conversion Rate is the share of those visits that became an order.
People
Section titled “People”- New Affiliates is how many signed up in the period.
- Active Affiliates is how many are approved and able to earn.
Performance Overview
Section titled “Performance Overview”Below the cards, a two-line chart plots Earnings and Visits across the period. It is the quickest way to see whether a campaign moved traffic, revenue, or neither.
An empty chart with a flat line at zero means there is no data in the selected period, not that tracking is broken. Widen the date selector before you go looking for a fault.
Revenue Impact
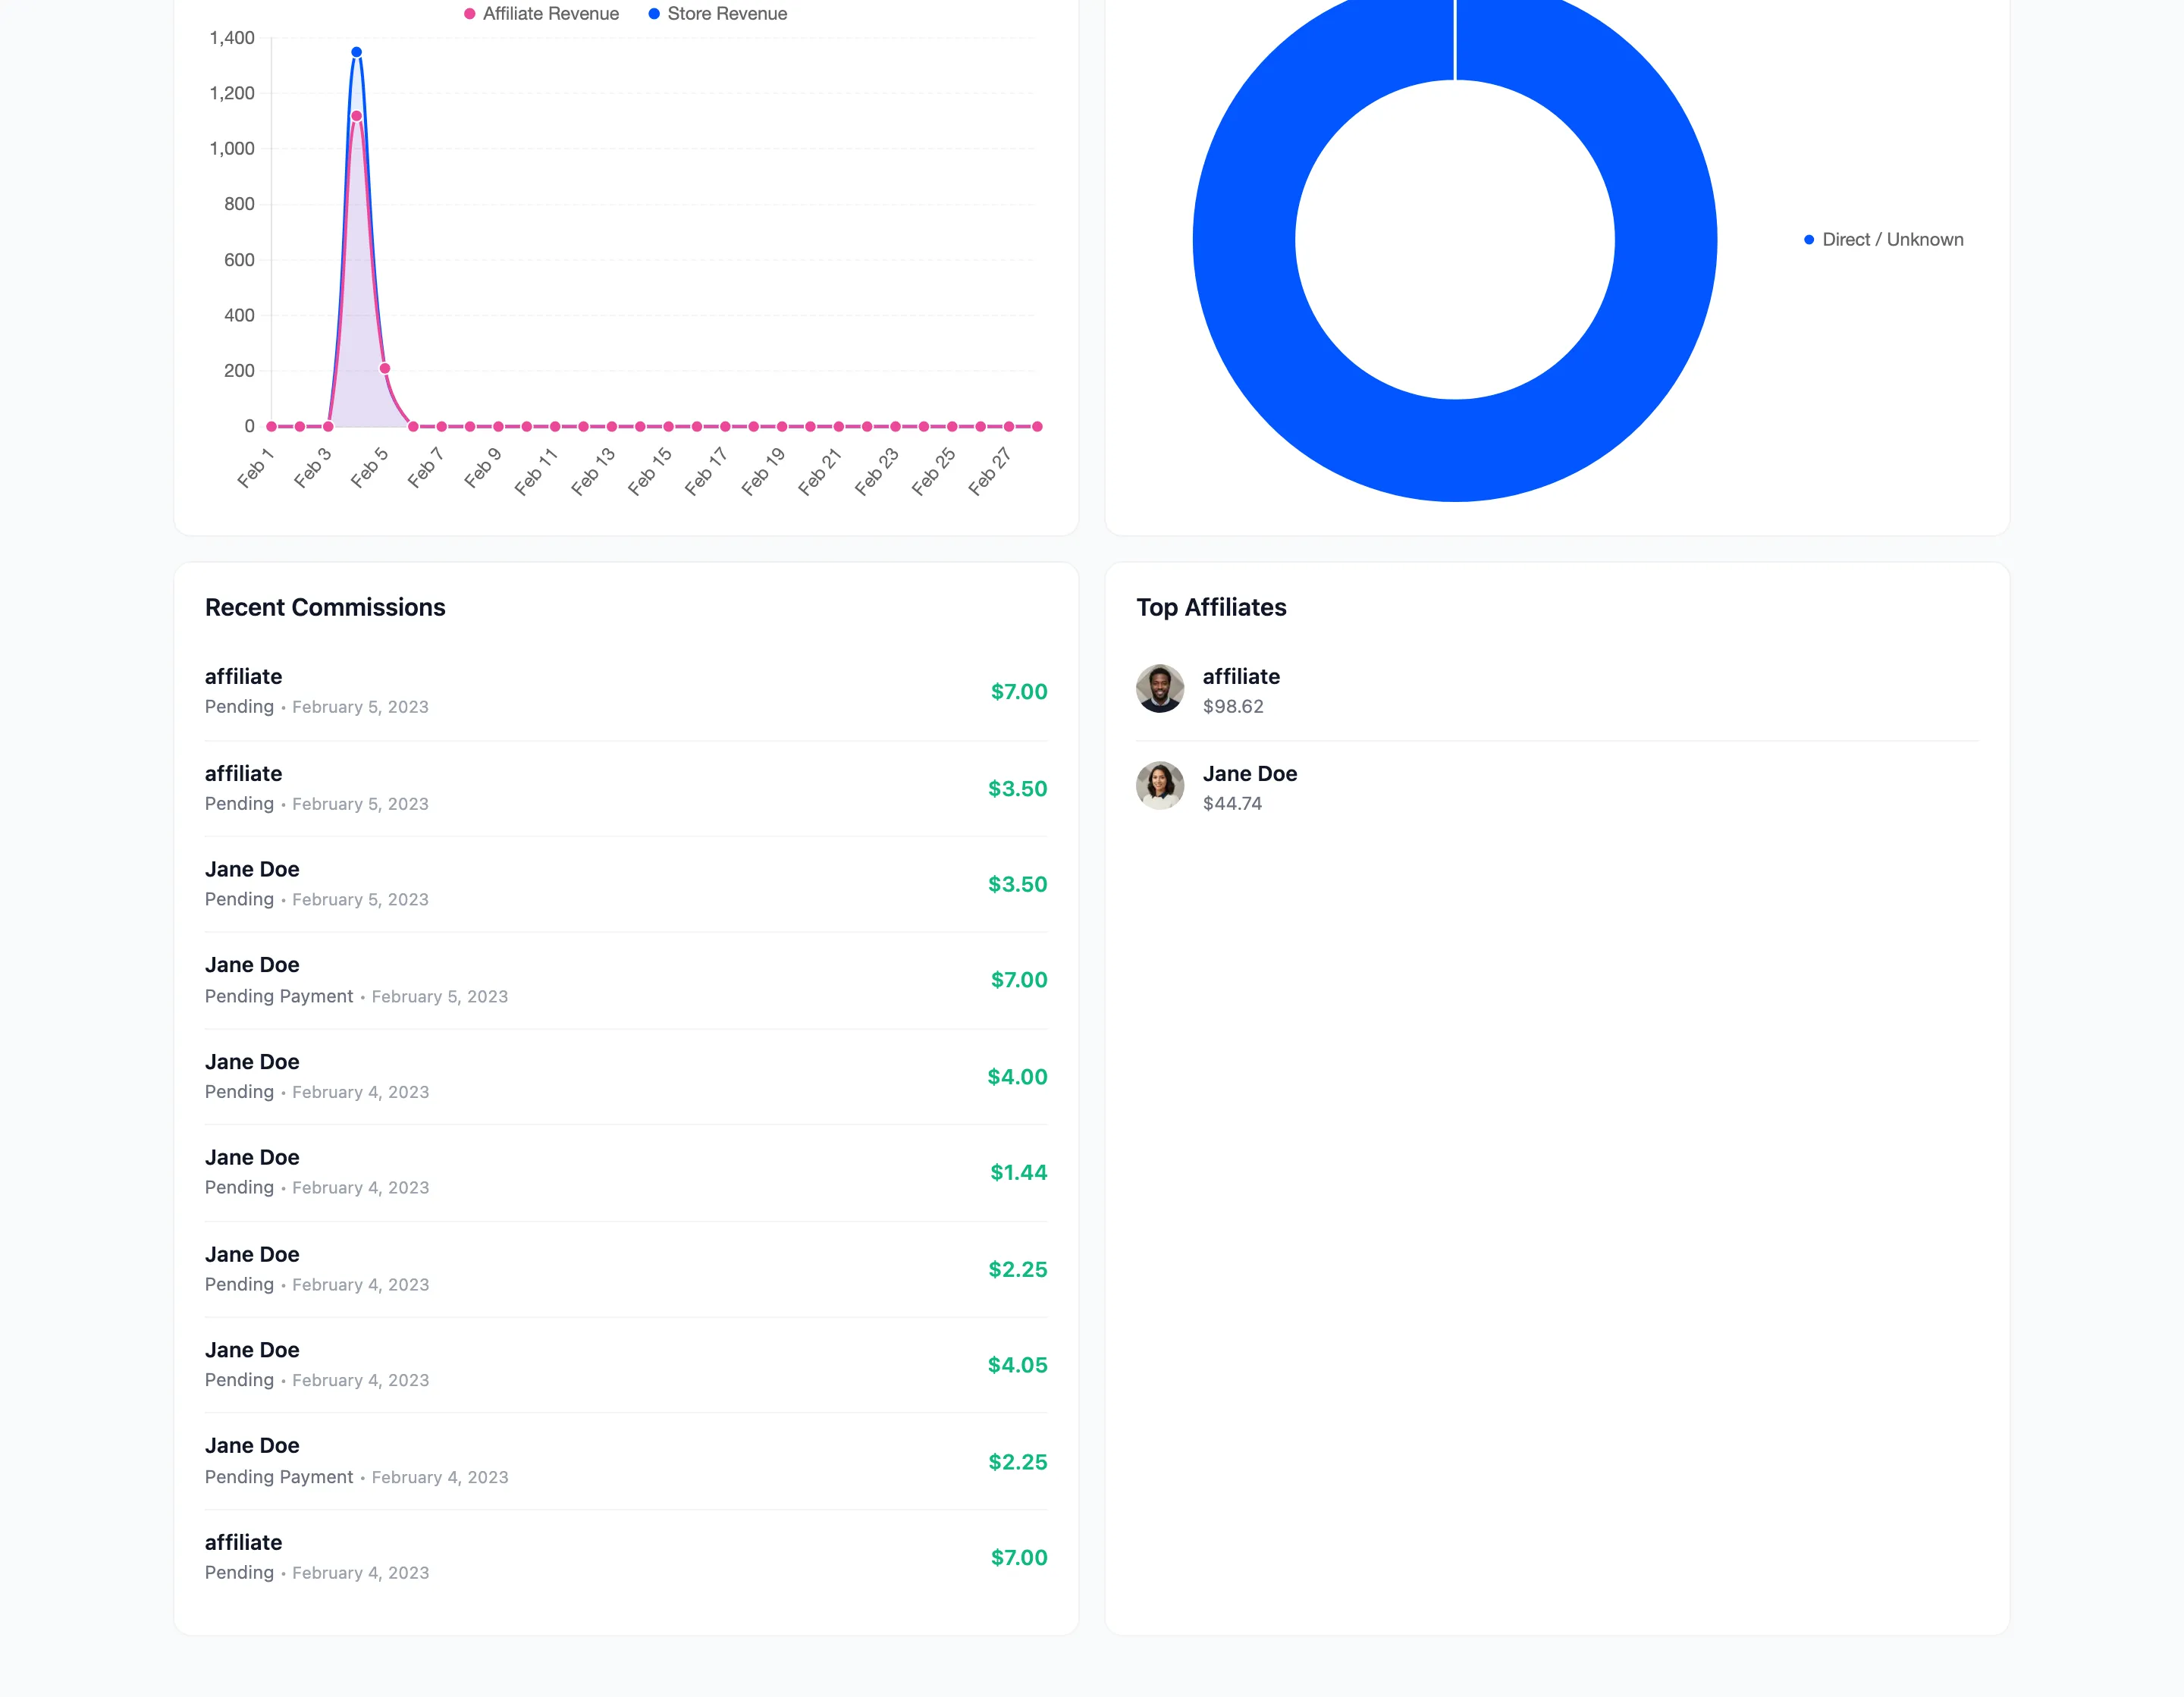
Section titled “Revenue Impact”This panel compares Affiliate Revenue against total Store Revenue. It is the number to quote when someone asks whether the program is worth running.
Conversion Sources
Section titled “Conversion Sources”A breakdown of where converting visits came from, built from the referrer URL recorded on each visit. Visits with no referrer show as direct.
Recent Commissions
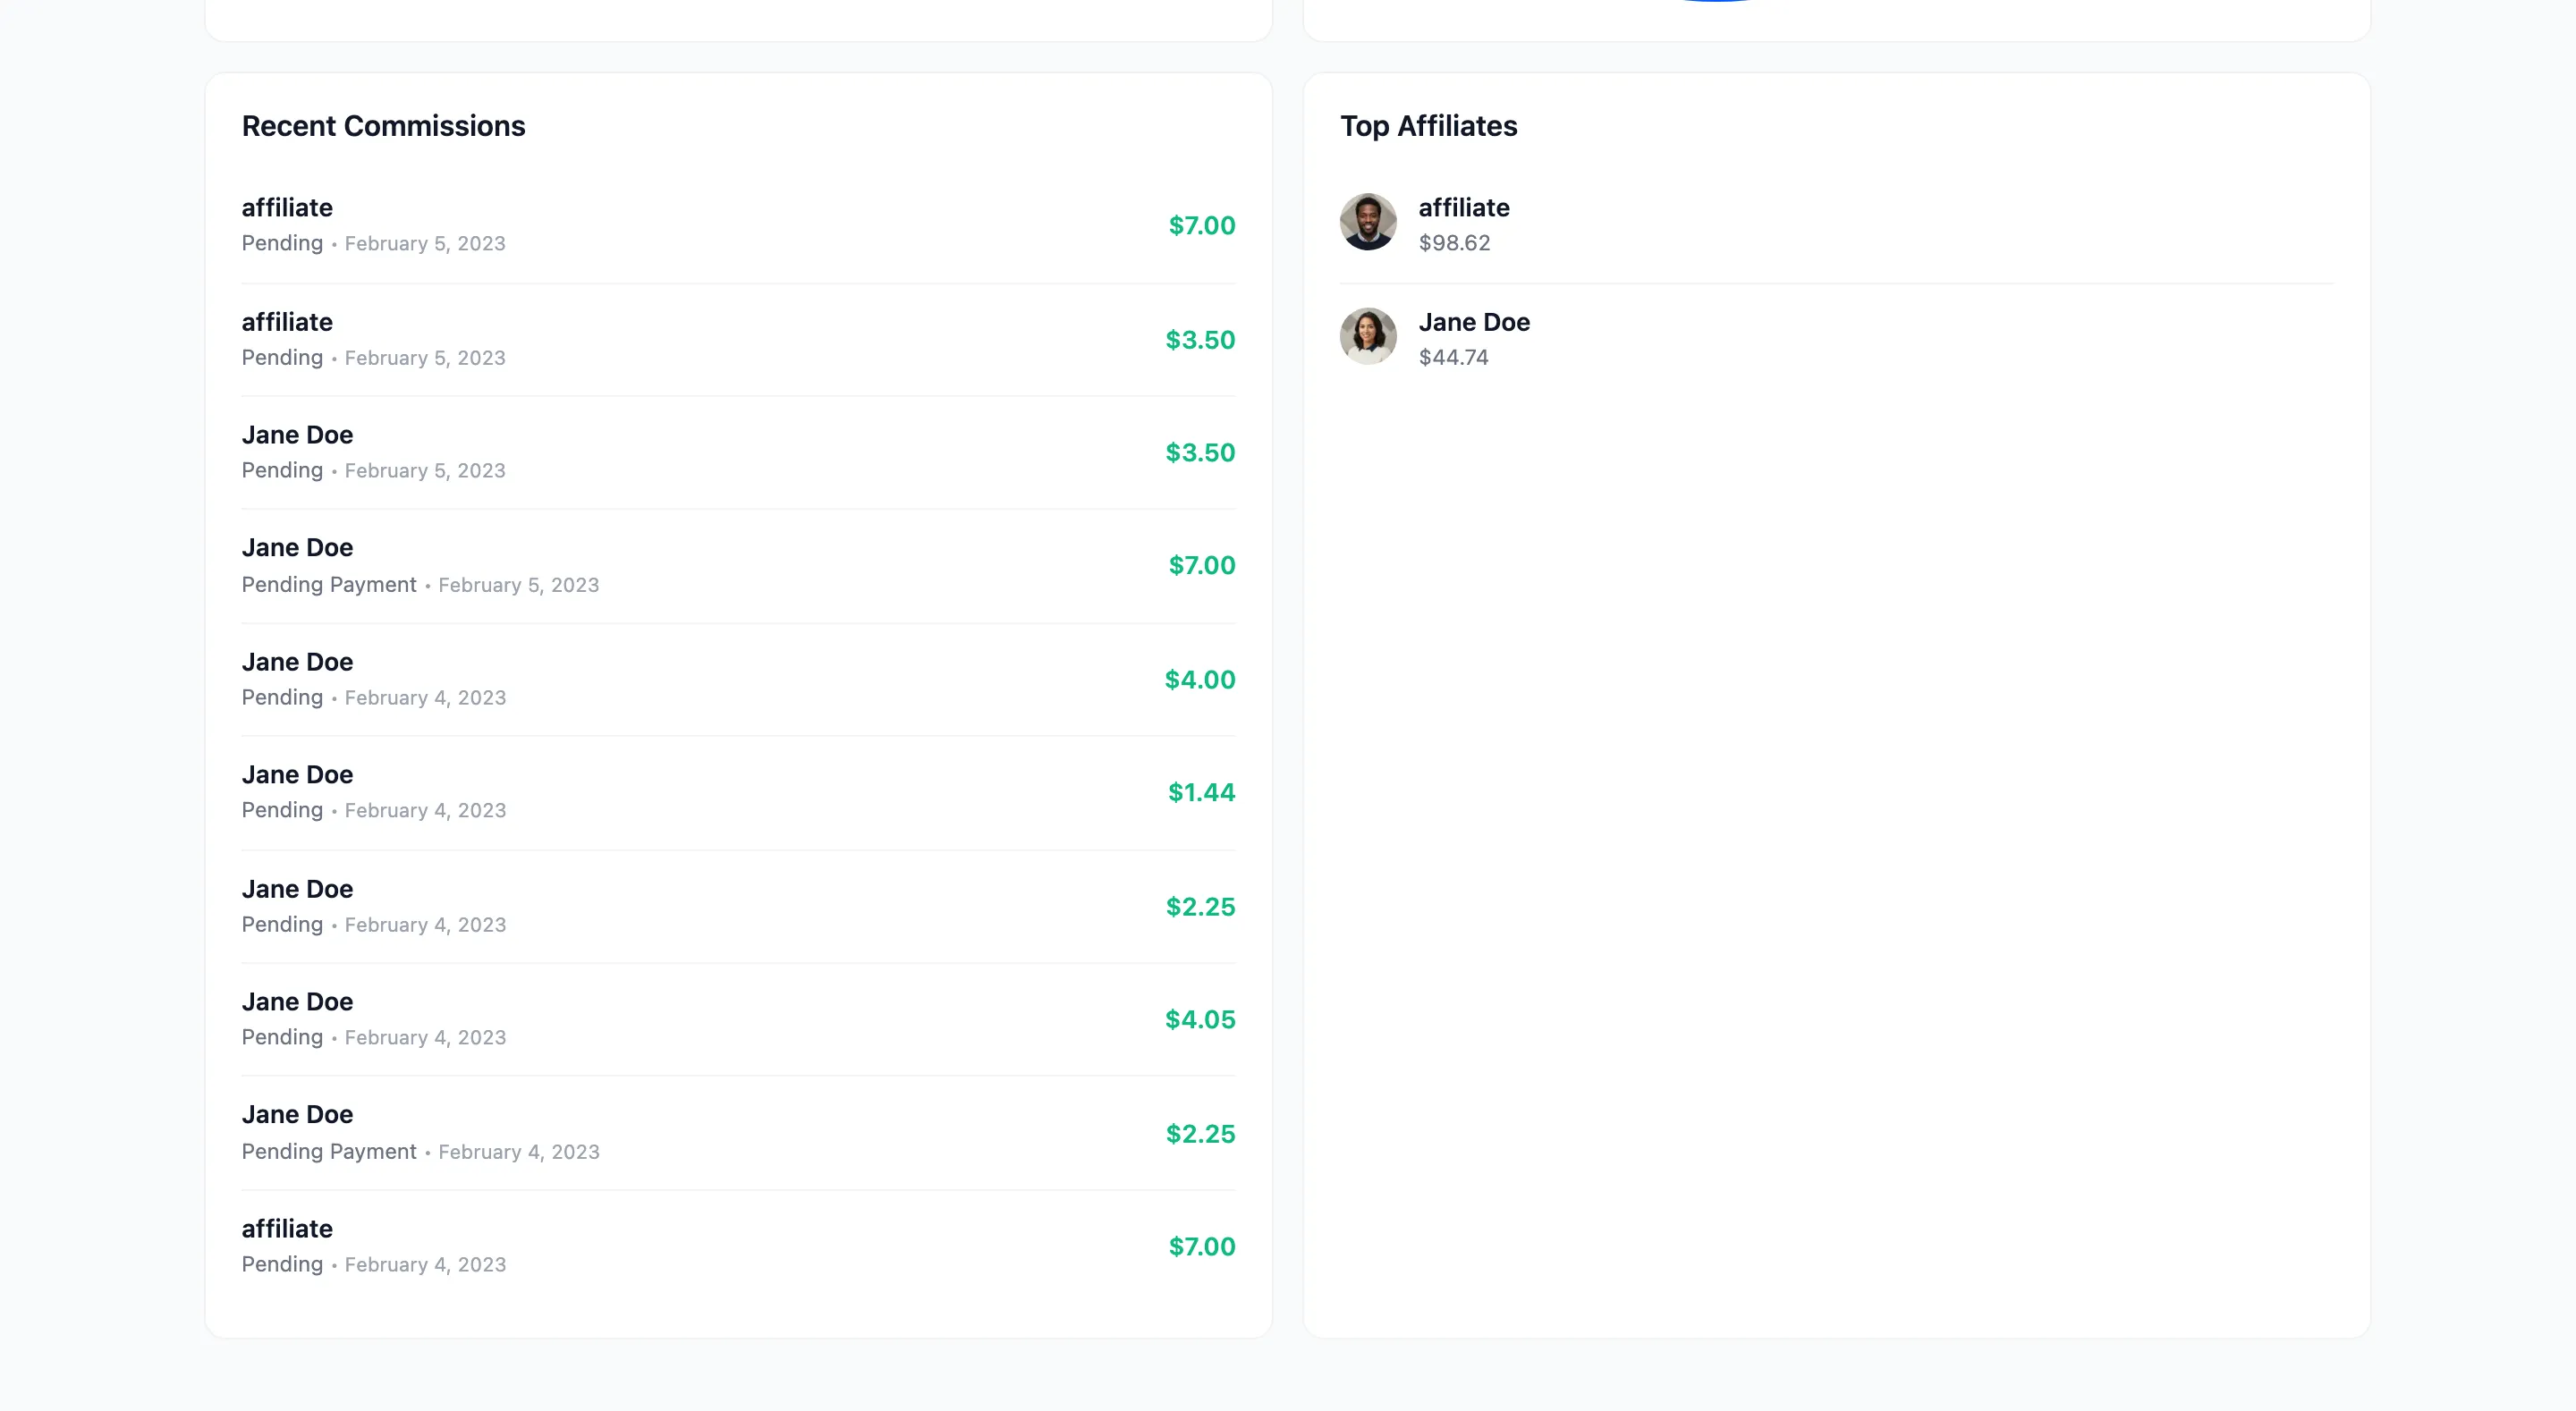
Section titled “Recent Commissions”The last few commission rows, each with the affiliate, the product and the amount. Click through to the Commissions screen for the full list with filters.
Top Affiliates
Section titled “Top Affiliates”Your highest earners in the period, sitting beside Recent Commissions in the panel above. Use it to decide who is worth a higher rate. You can set a per-affiliate rate on the affiliate’s own screen.
When the dashboard is empty
Section titled “When the dashboard is empty”Three checks, in order.
- The date range. This Month hides everything older.
- Enable Affiliate System under Configuration → General. With it off, nothing tracks.
- Affiliate status. Only an Approved affiliate’s link sets a cookie or logs a visit.
Where to go next
Section titled “Where to go next”- Reports for date-range comparison across eight metrics.
- Affiliates to approve signups and set rates.