

Reports
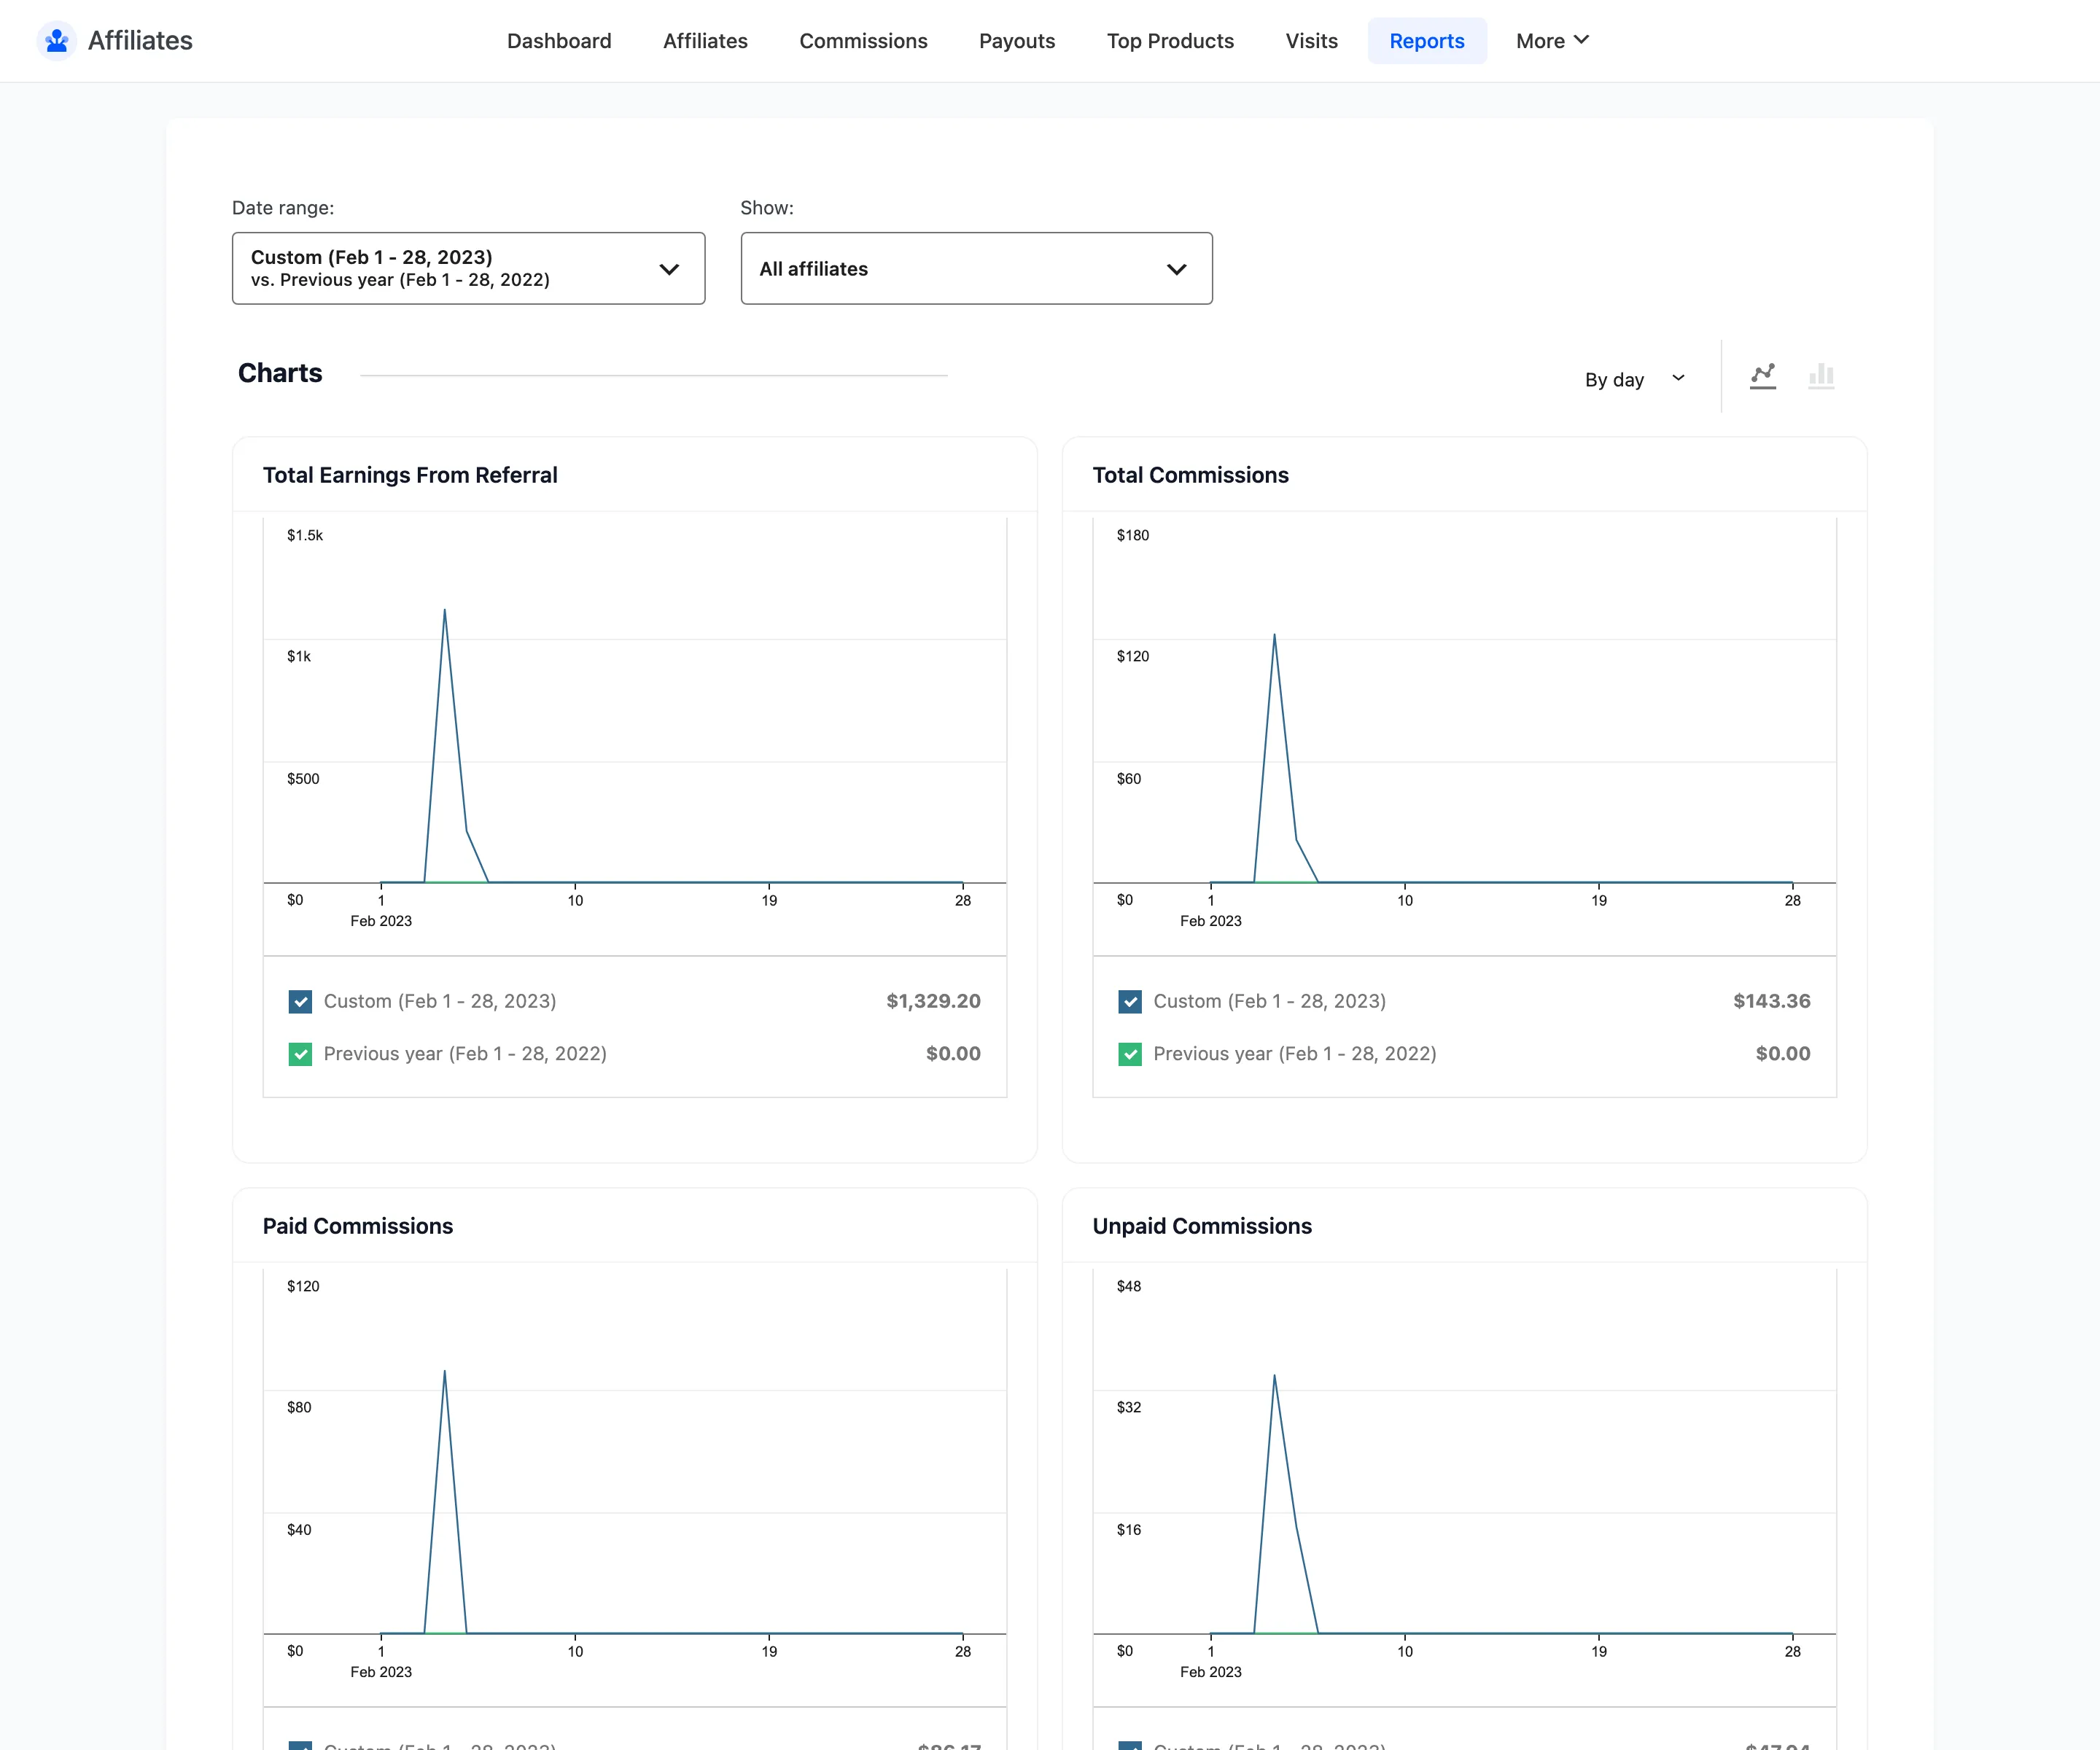
Reports is the analysis screen. Eight metrics, charted over a range you choose, each compared against an earlier period.
Open Reports
Section titled “Open Reports”Go to DevDiggers Plugins → Affiliates → Reports.
The two controls
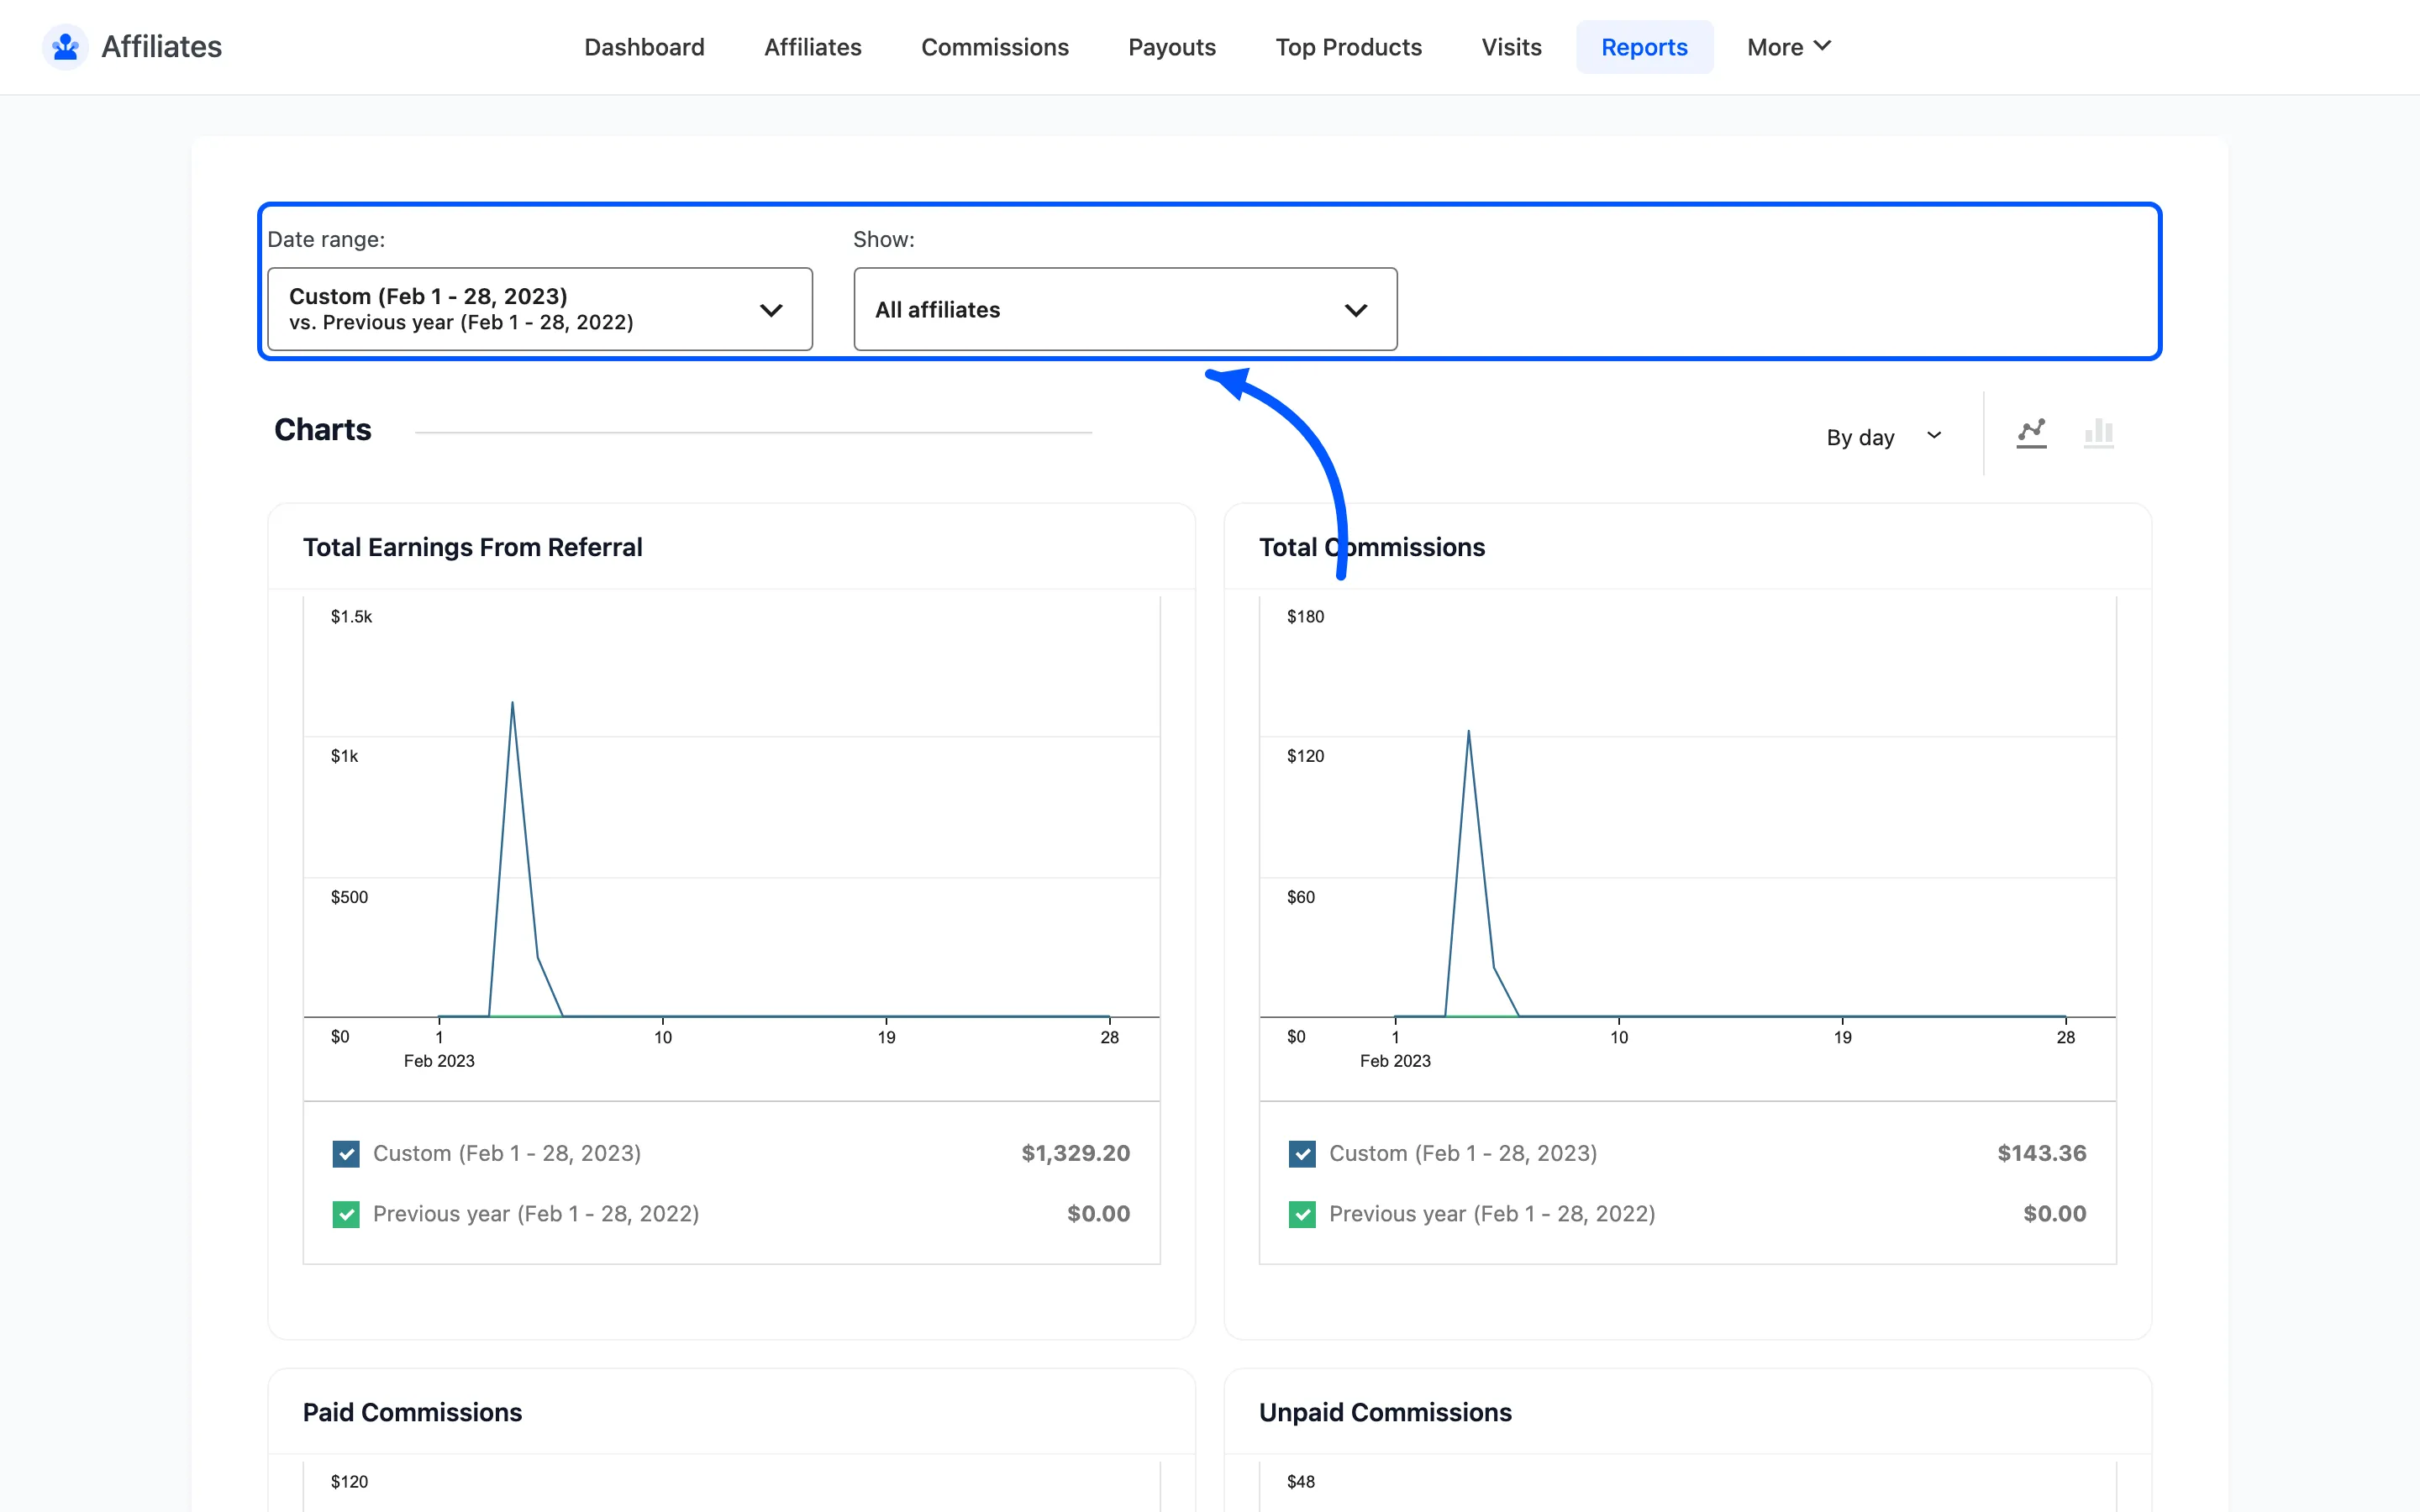
Section titled “The two controls”- Date range picks the period and what it compares against. It offers the usual presets plus a custom range, and a comparison of either the previous period or the previous year. Comparing against the previous year is the honest read for a seasonal store, where last month is never a fair baseline.
- Show filters to All affiliates or one affiliate. Combined with the range, that turns a vague sense that a partner has gone quiet into a number.
The eight charts
Section titled “The eight charts”| Chart | What it plots |
|---|---|
| Total Earnings From Referral | Order value driven by affiliates |
| Total Commissions | Commission created |
| Paid Commissions | Commission in a completed payout |
| Unpaid Commissions | Commission still owed |
| Refunded Commissions | Commission reversed by refunds |
| Total Visits | Referral clicks |
| Total Conversions | Visits that became orders |
| Conversion Rate (%) | The rate between the two |
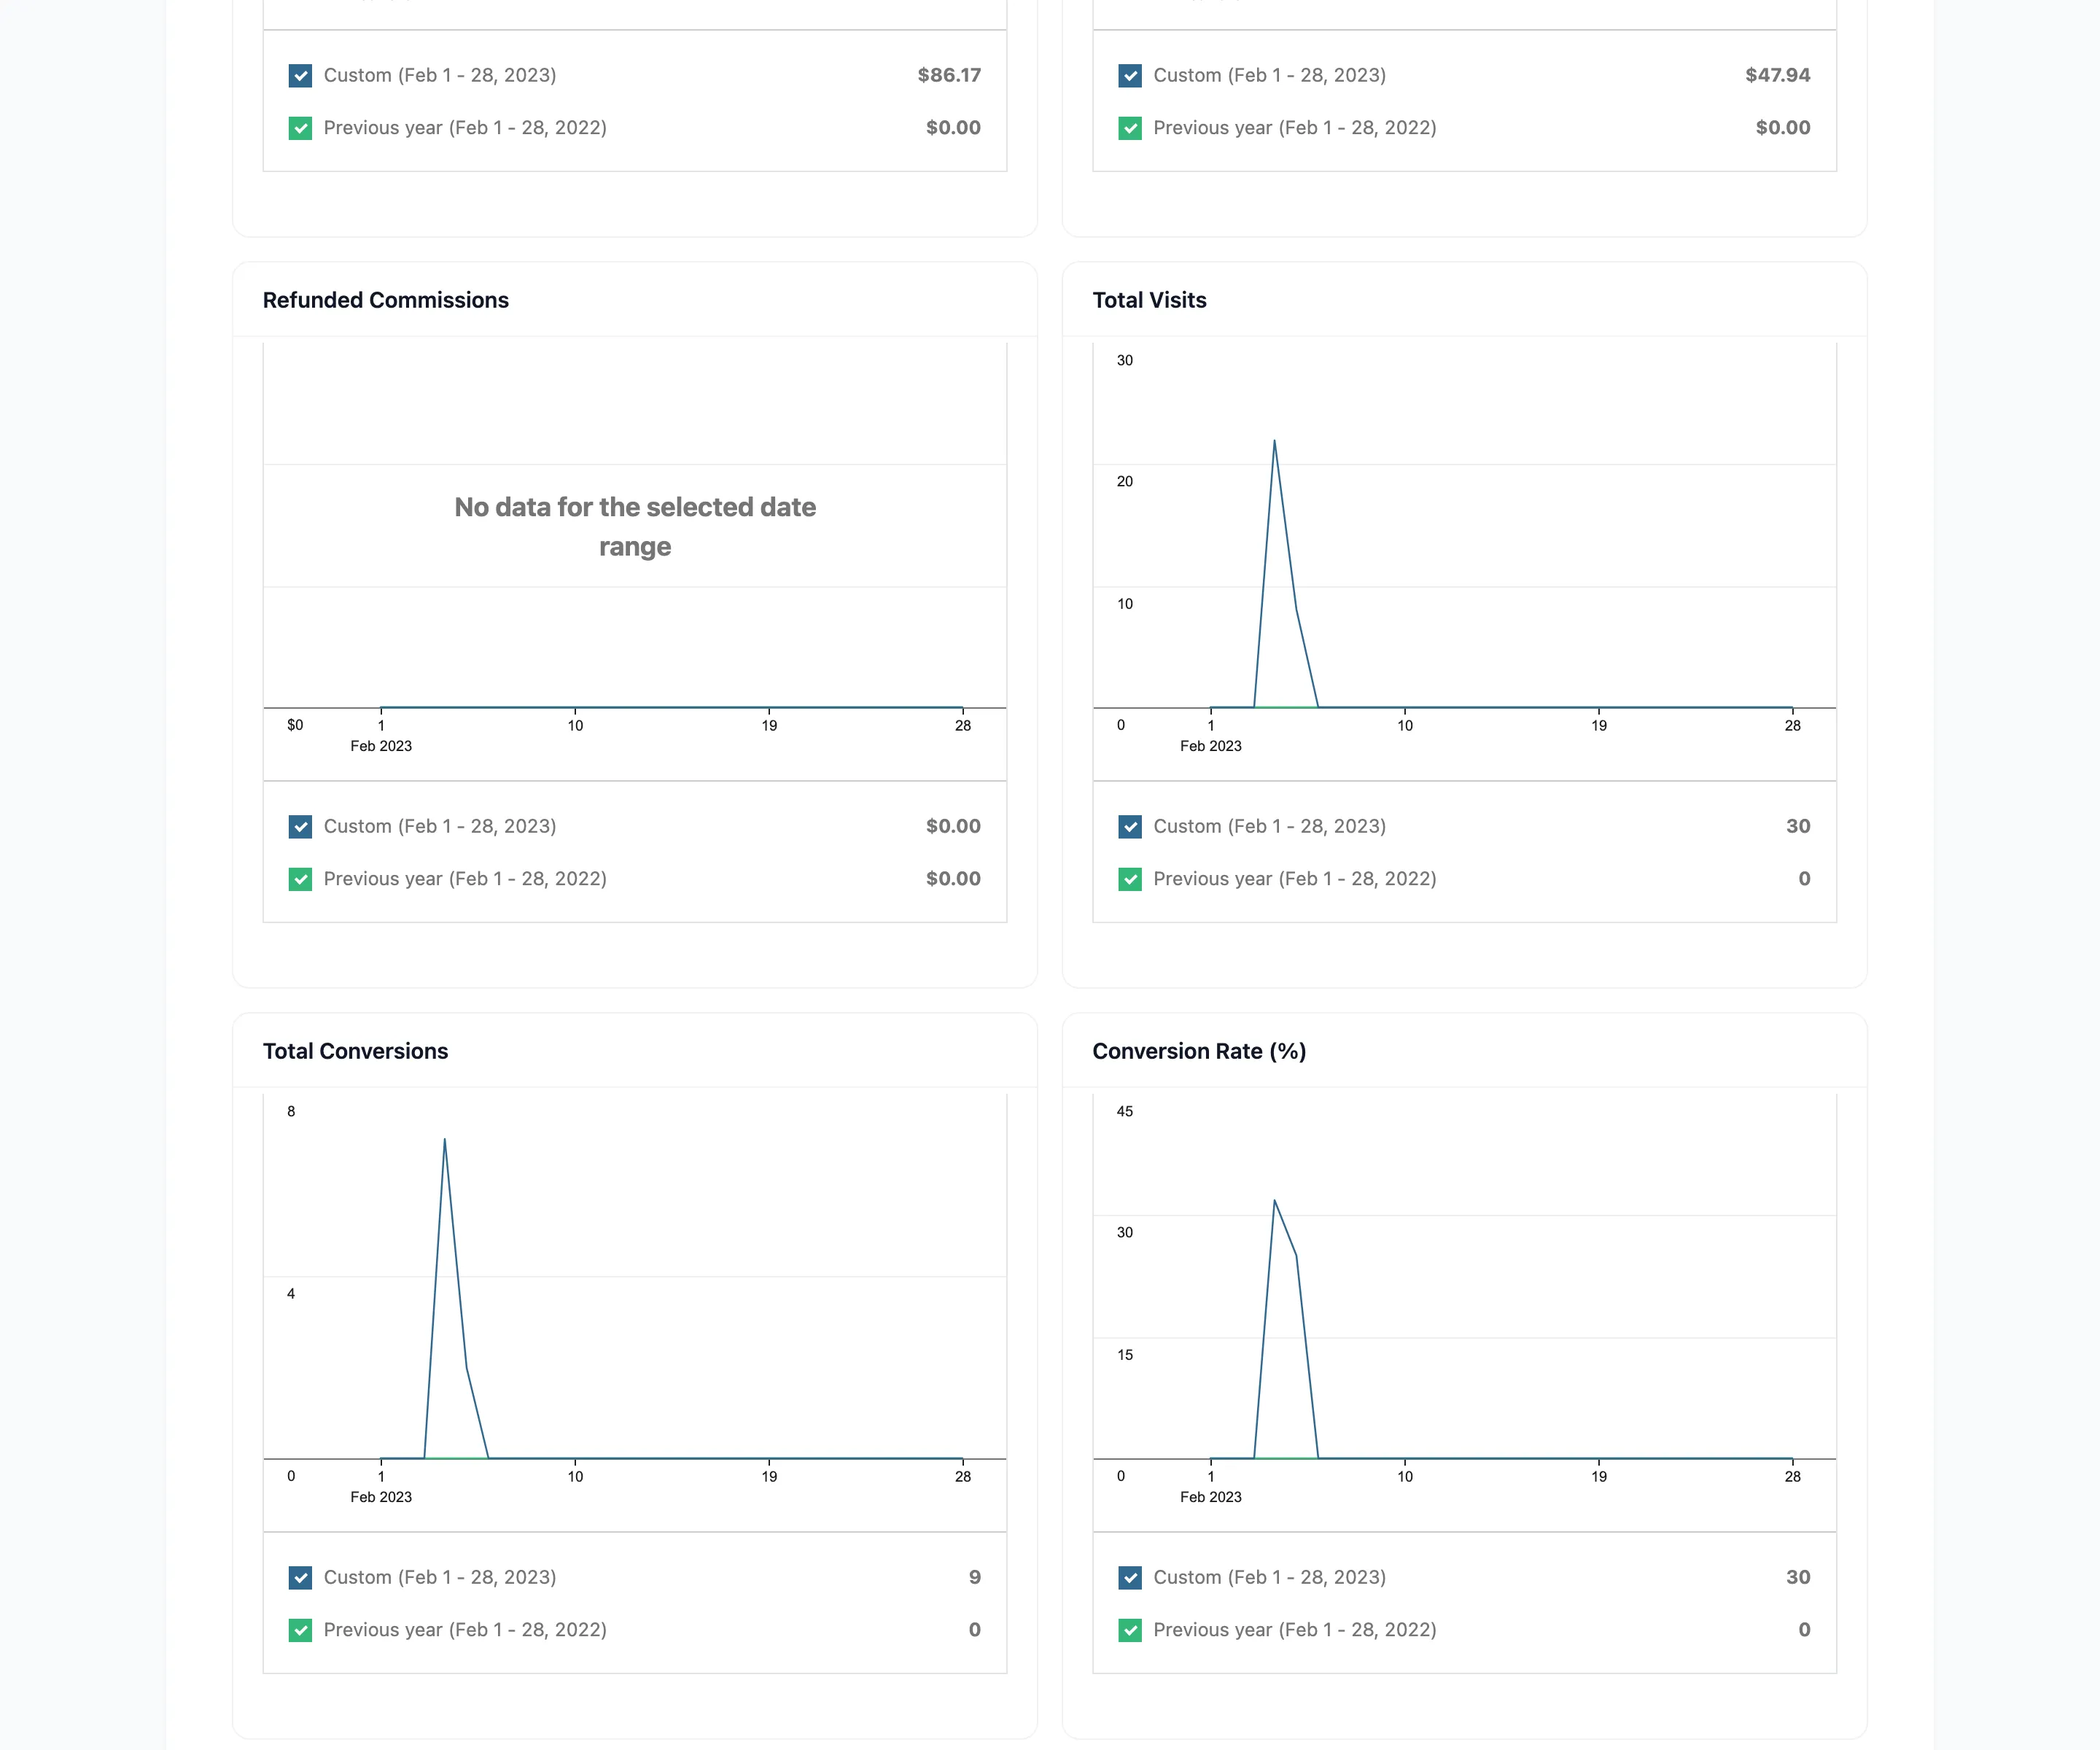
Each chart shows the period total and the comparison total beneath it, so the direction of travel is readable without reading the line.
The pairing that matters most is Total Earnings From Referral against Total Commissions. The gap between them is what the program actually returns.
Granularity and chart type
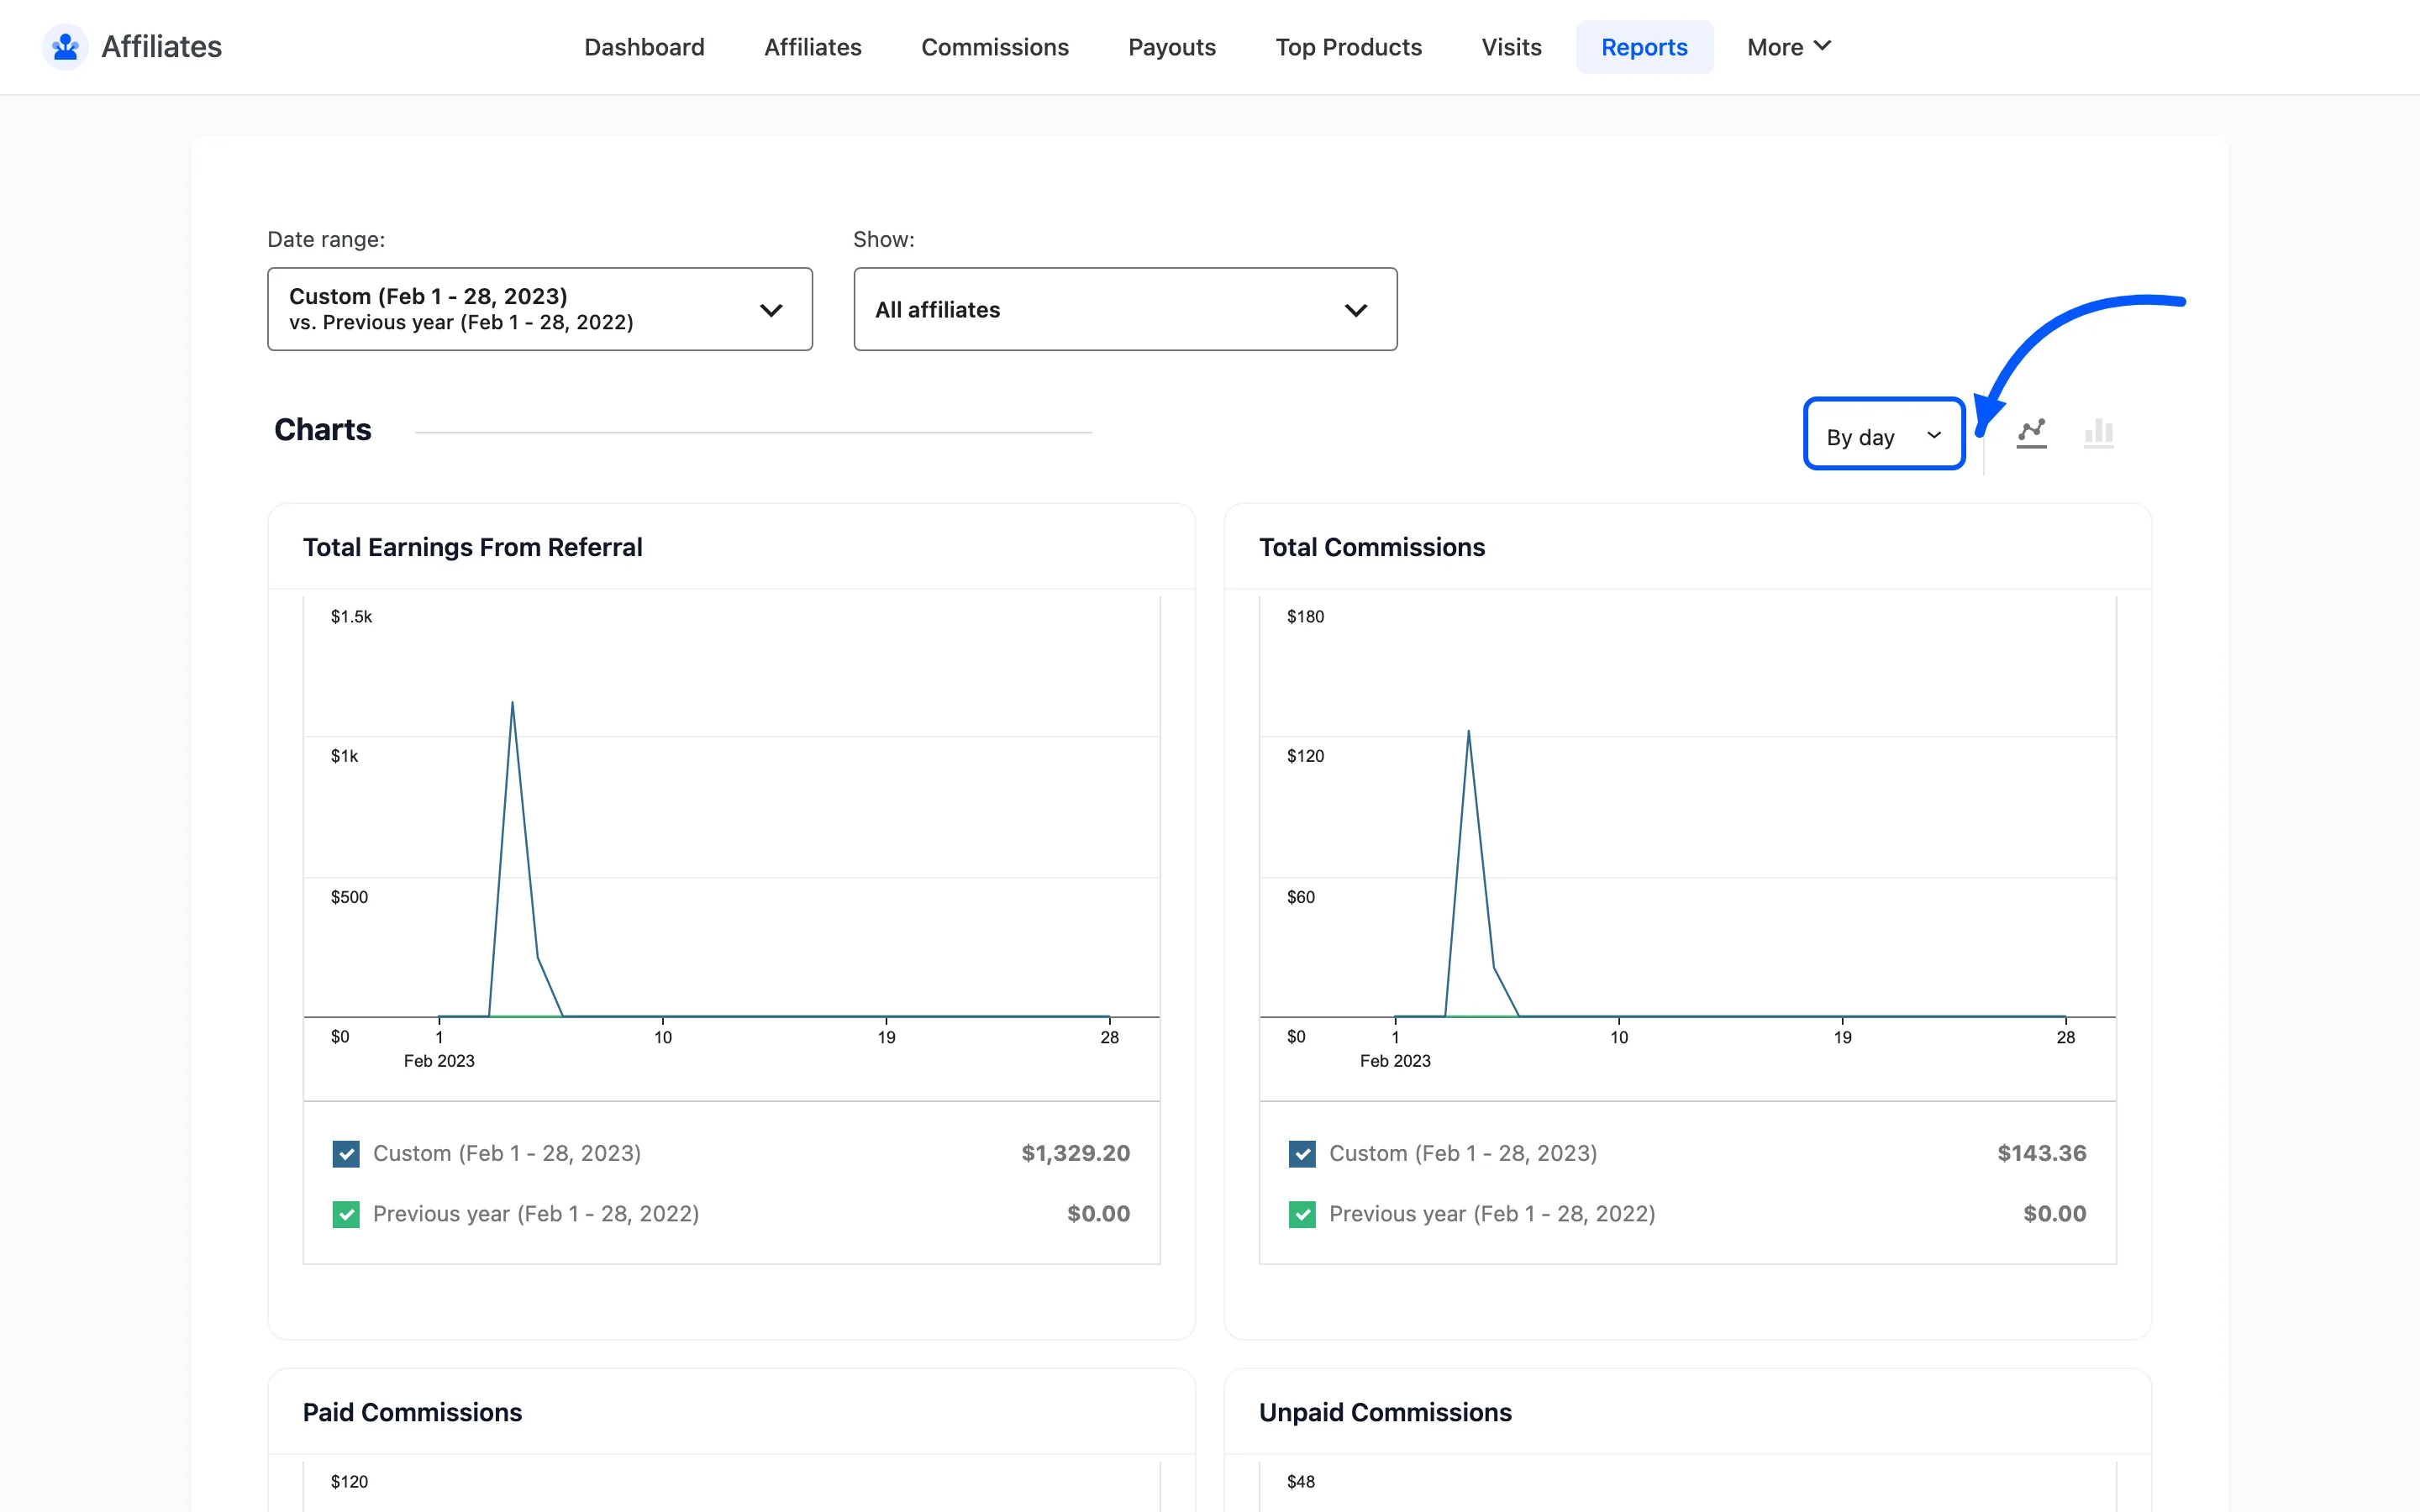
Section titled “Granularity and chart type”A By day selector switches the interval, and two icons switch between a line and a bar chart. Days suit a campaign, months suit a year in review.
Reading Refunded Commissions
Section titled “Reading Refunded Commissions”This chart is easy to skip and worth watching. A rising refund line under flat earnings means an affiliate is driving orders that do not stick. That costs more than the earnings chart alone suggests. Filter Show to each affiliate in turn to find the source.
Where to go next
Section titled “Where to go next”- Dashboard Overview for the at-a-glance version.
- Affiliate Details for one partner’s full history.