

The Customer Tracking Dashboard
The dashboard is the first screen under DevDiggers Plugins → Customer Tracking. It shows how shoppers moved through the store in a period, where they came from and what was won back.
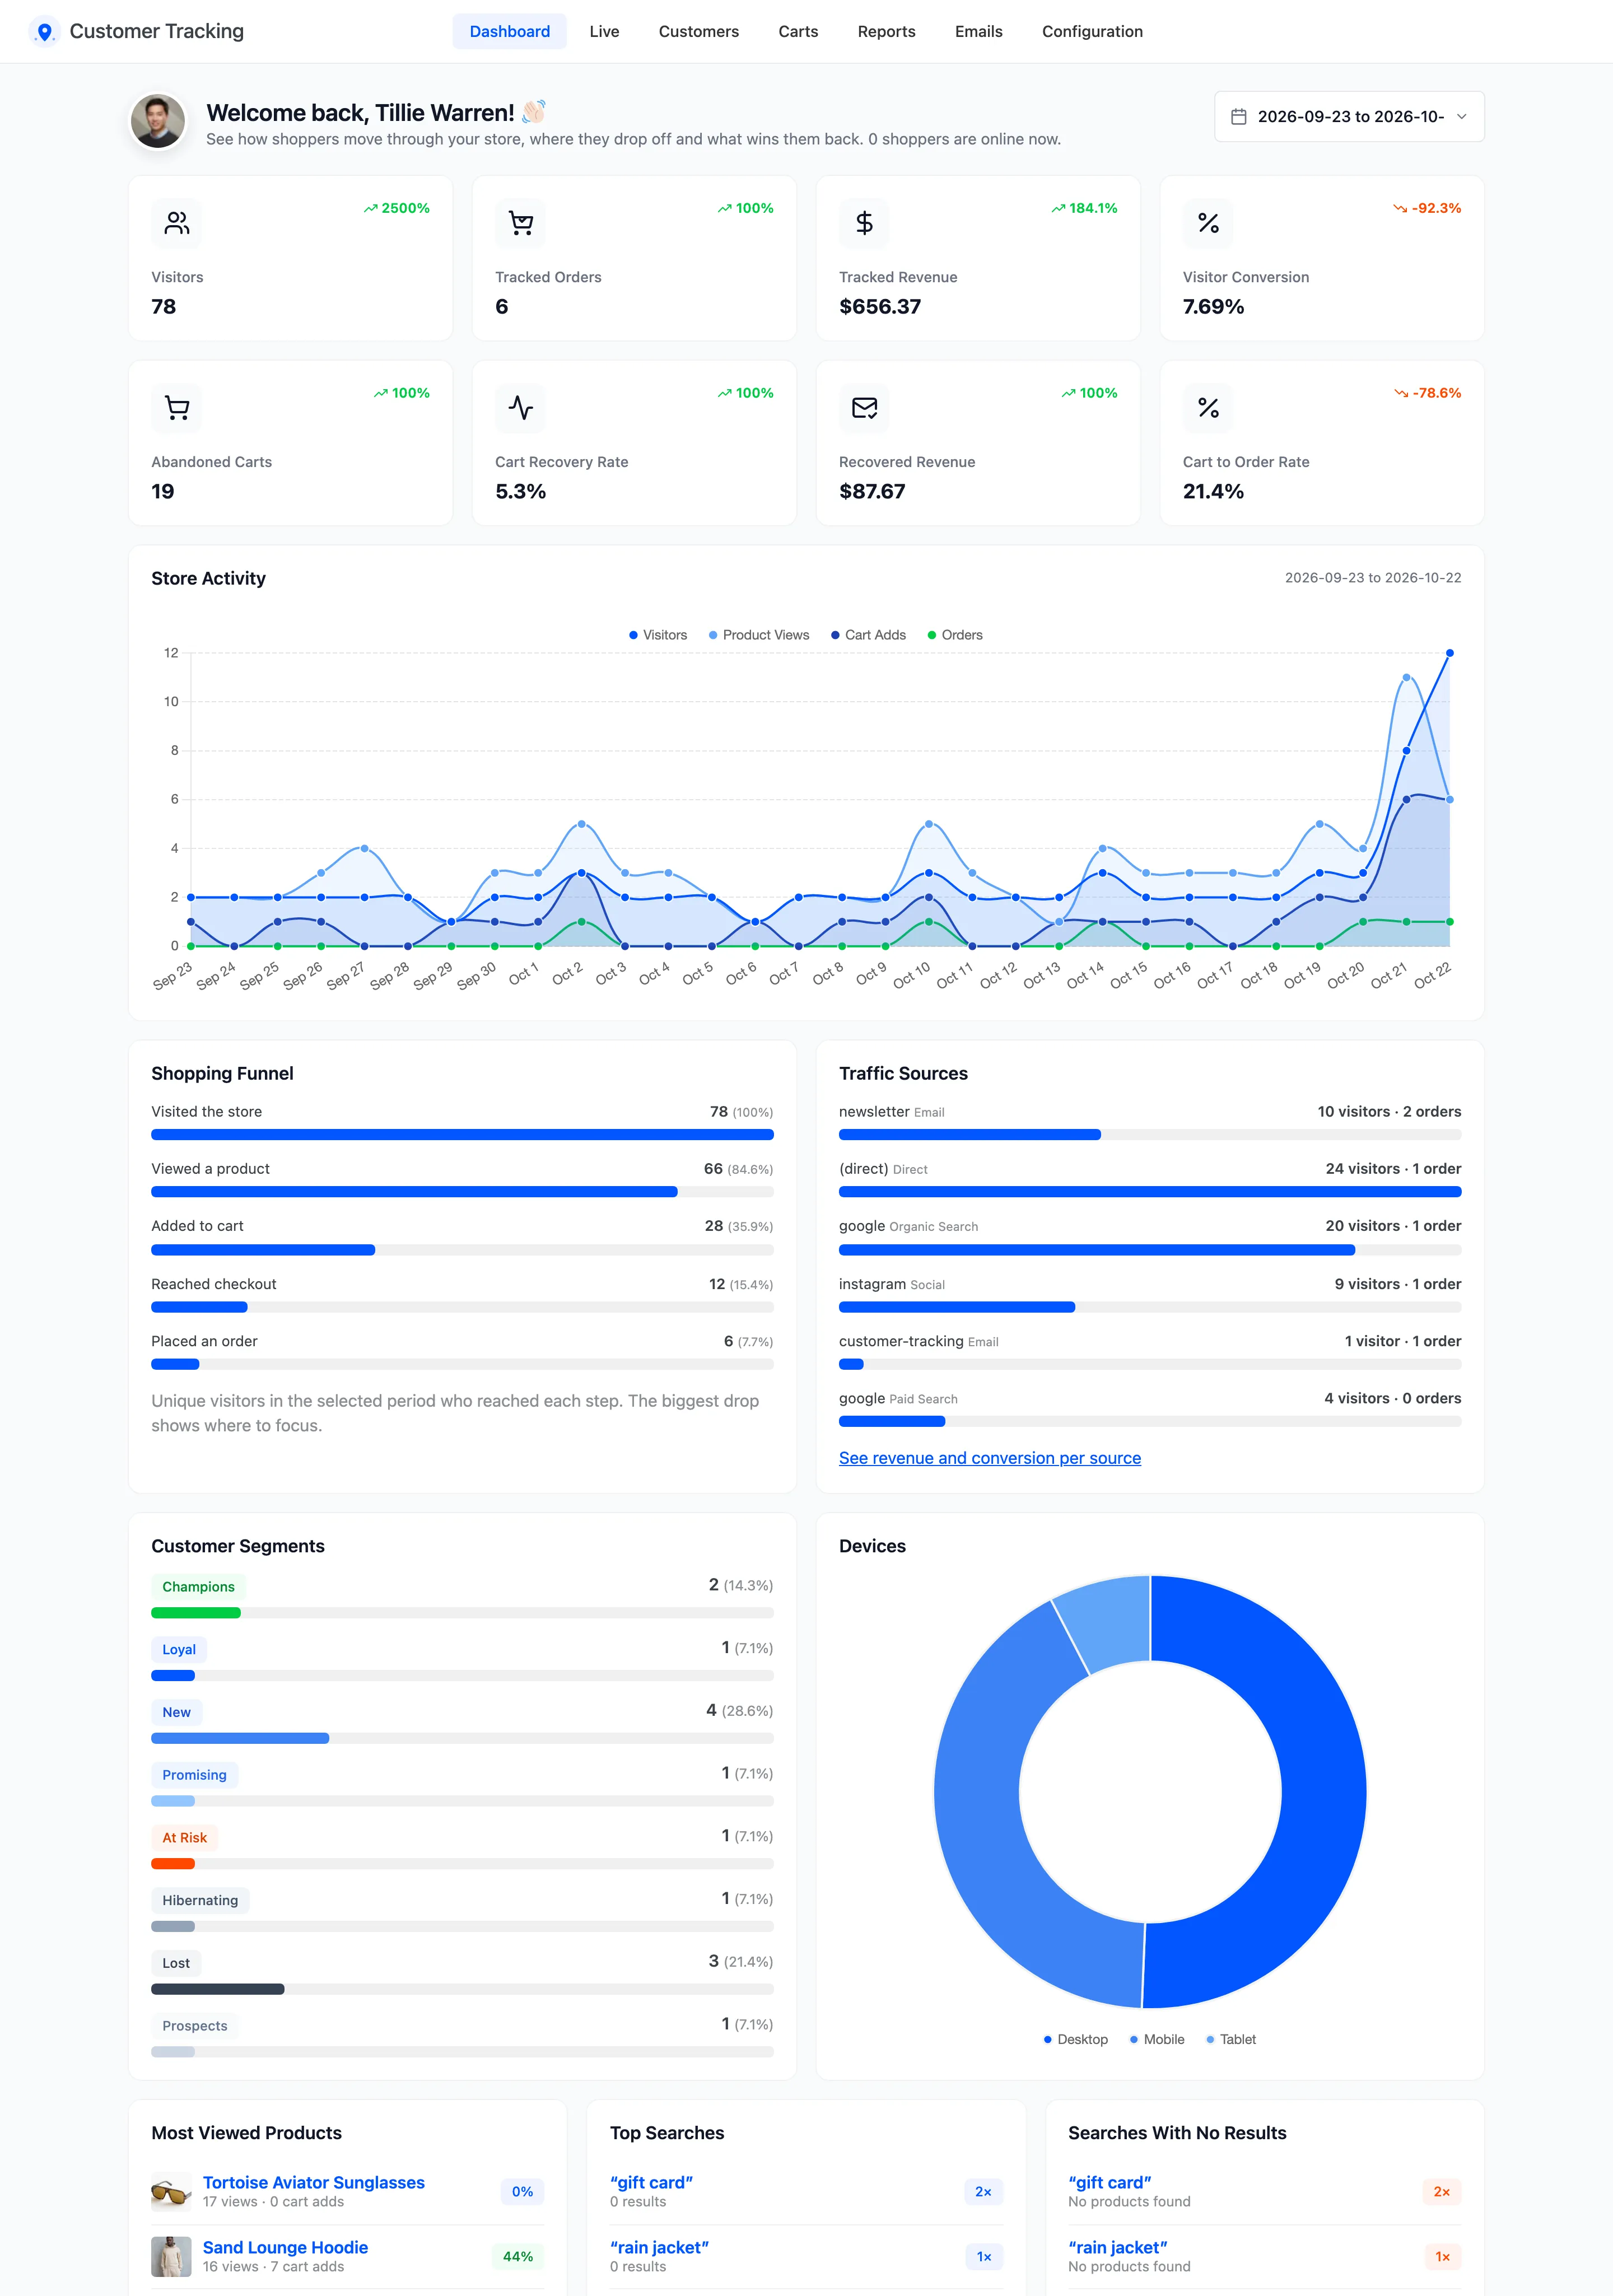
The date range
Section titled “The date range”Pick a period at the top right: a preset from Today to All Time, with This Month as the default, or your own dates. The shots on this page cover the last 30 days. Every card compares the period with the one just before it, of the same length. The subtitle says how many shoppers are online right now.
The numbers are kept for 10 minutes once worked out, so a busy store’s dashboard opens quickly. A visit from a minute ago may take that long to show here. The Live screen is never delayed.
The eight cards
Section titled “The eight cards”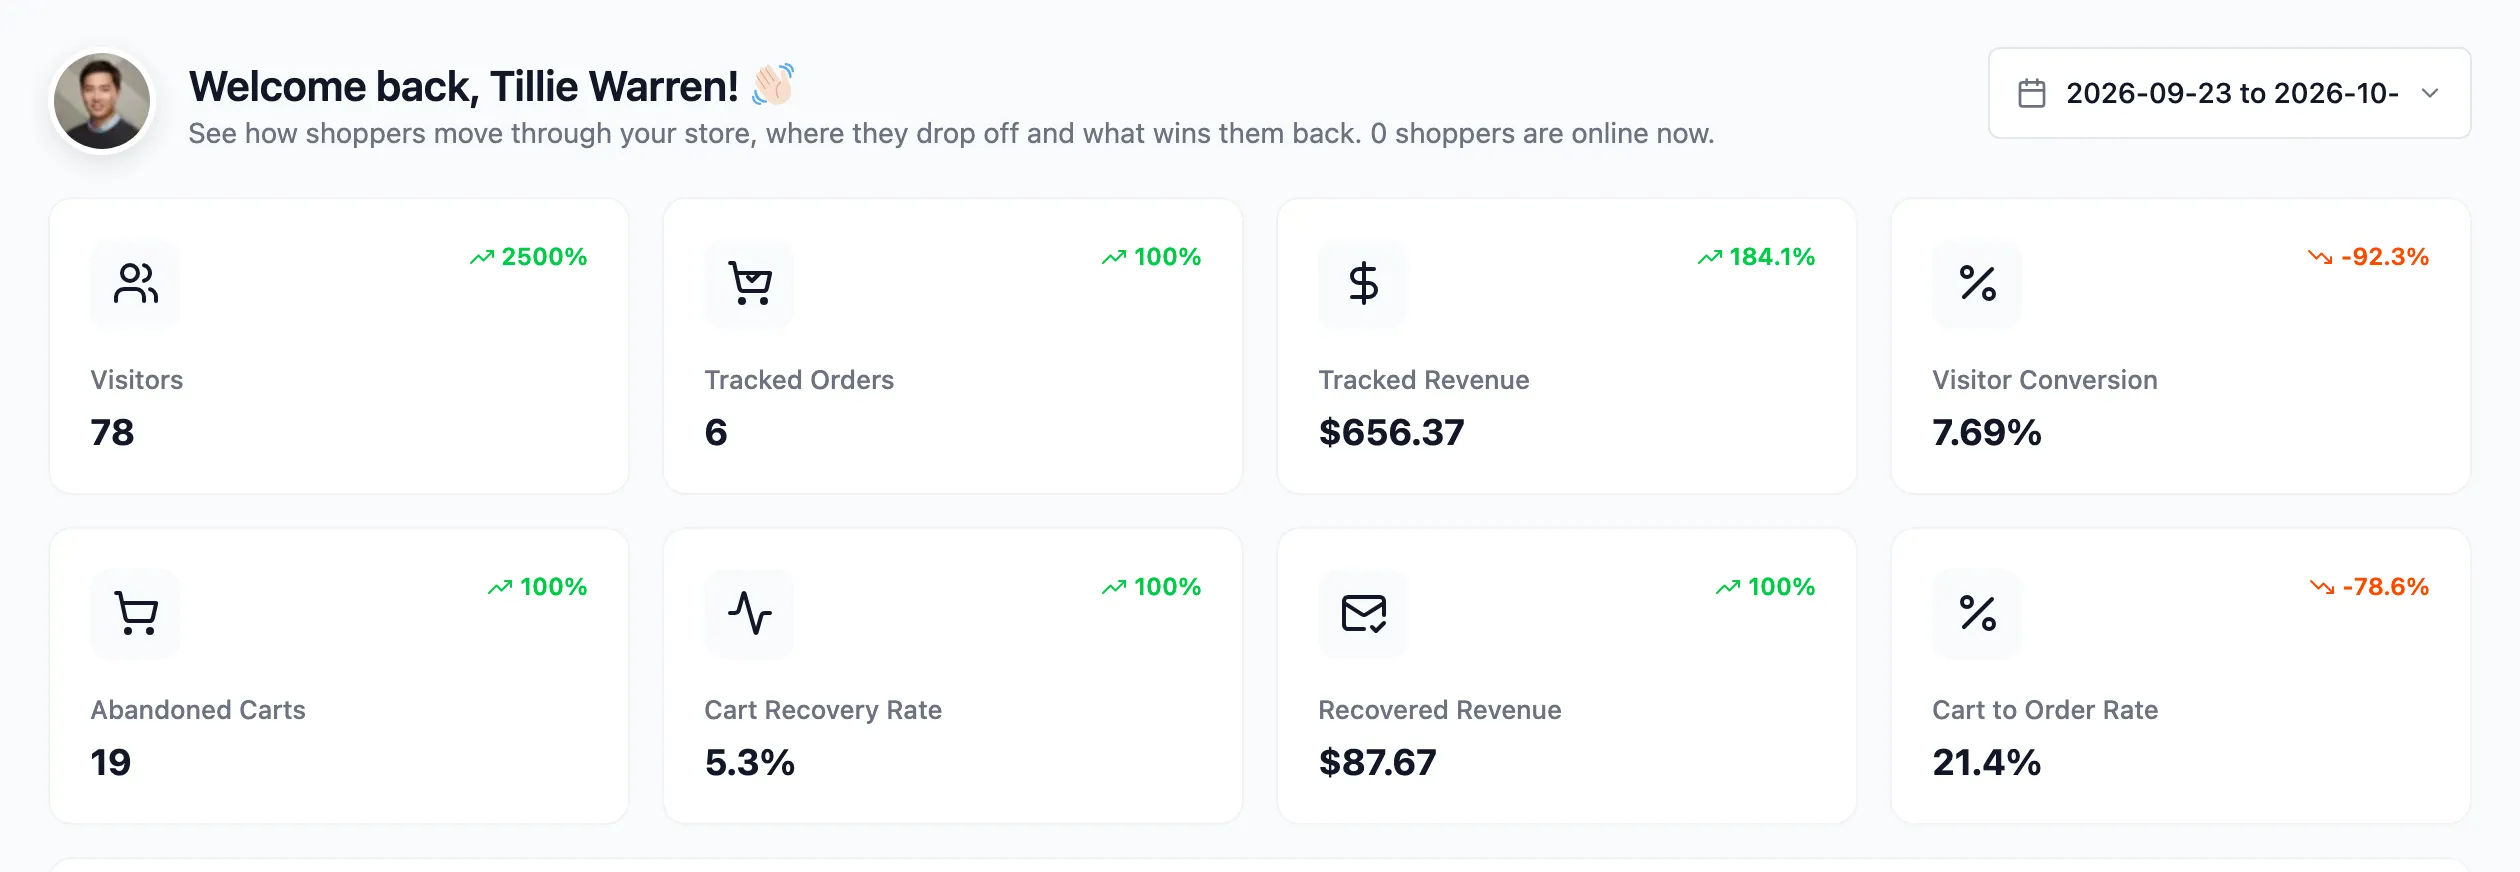
- Visitors: Unique visits in the period.
- Tracked Orders and Tracked Revenue: Paid orders from tracked visits, and their totals at the time they were placed. An unpaid or failed order is not counted.
- Visitor Conversion: The share of visitors who placed an order.
- Abandoned Carts: Carts abandoned in the period.
- Cart Recovery Rate: Recovered carts as a share of those abandoned carts.
- Recovered Revenue: Revenue credited to the plugin’s emails: paid orders that followed a reminder, a browse abandonment email or a manual email.
- Cart to Order Rate: The share of visitors who added to the cart and then ordered.
Tracked orders count only orders placed by tracked visitors. Orders from excluded staff, from before the plugin was installed, or entered by hand in the admin are not in them. For your full sales, use WooCommerce → Analytics.
Store Activity
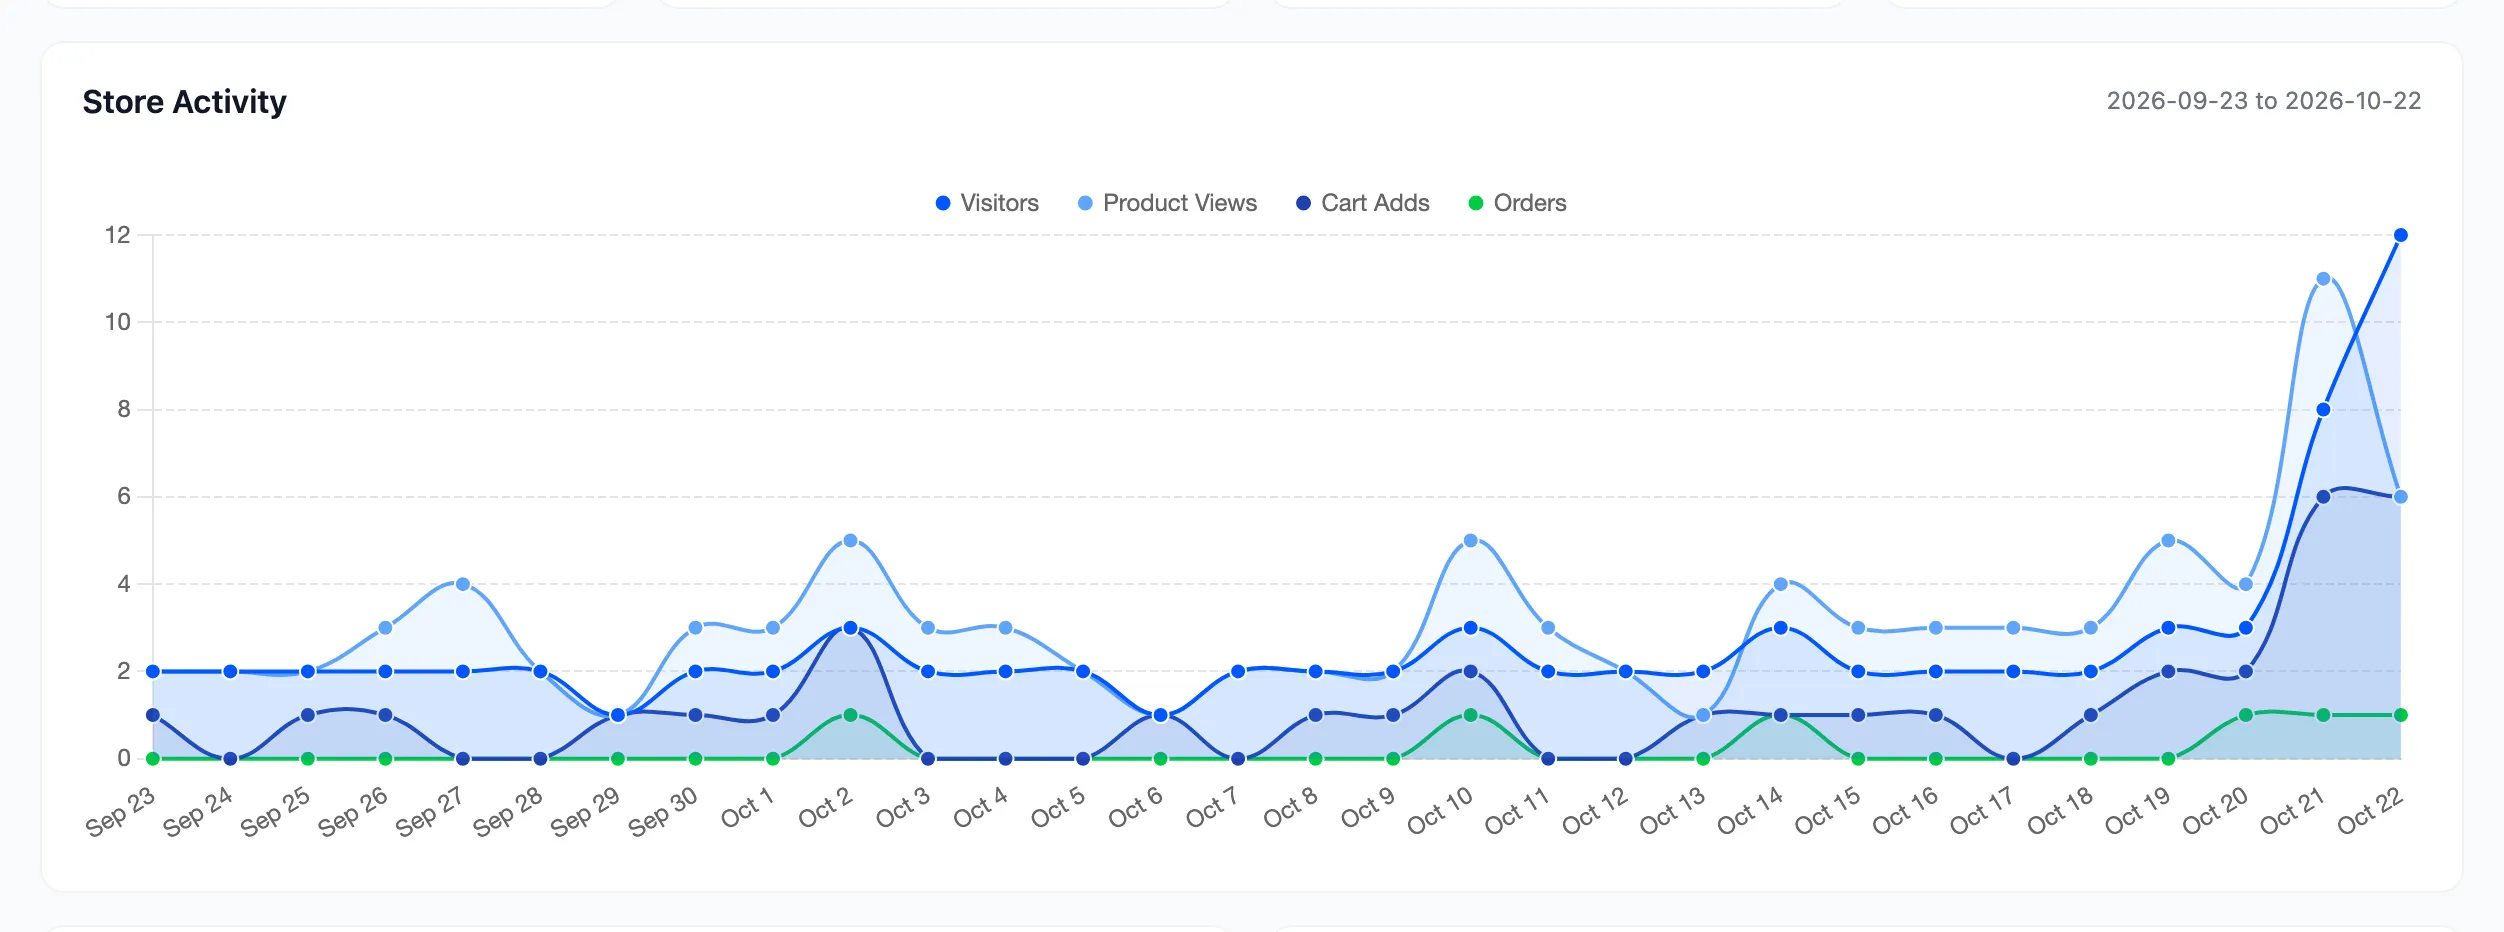
Section titled “Store Activity”A daily chart of visitors, product views, cart adds and orders.
Shopping Funnel and Traffic Sources
Section titled “Shopping Funnel and Traffic Sources”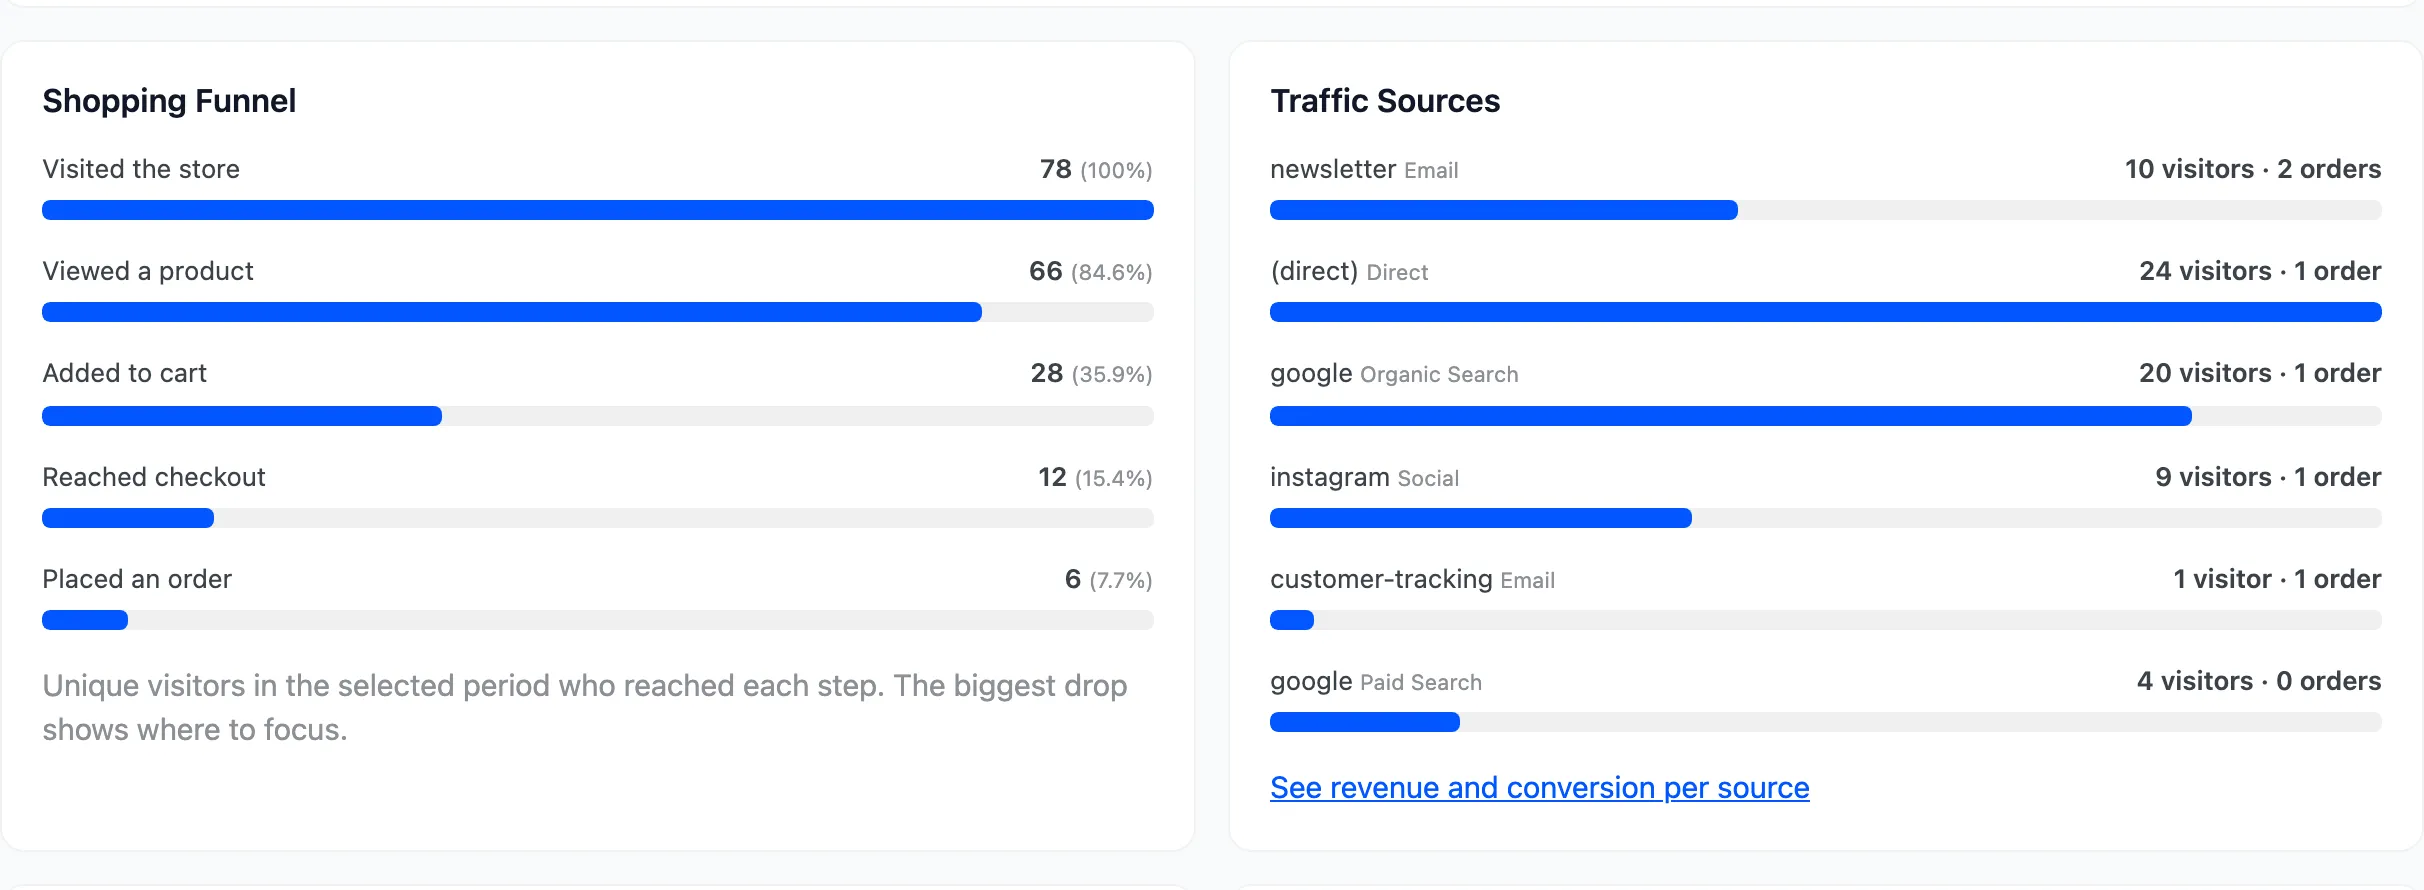
The Shopping Funnel counts unique visitors at each step: visited the store, viewed a product, added to cart, reached checkout and placed an order. The biggest drop is where to look first. A big drop between cart and checkout often means shipping costs shown too late.
Traffic Sources lists the channels that brought visitors, with their orders. See Traffic Sources.
Customer Segments and Devices
Section titled “Customer Segments and Devices”
Customer Segments shows how many customers sit in each RFM segment. Click one to open those customers. Devices splits visitors between desktop, mobile and tablet.
Products and searches
Section titled “Products and searches”
- Most Viewed Products: Views and cart adds per product.
- Top Searches: What shoppers typed, how often, and how many results they got.
- Searches With No Results: Demand you are not meeting. Add those words to product titles or tags, or stock the product.
Customers, countries and activity
Section titled “Customers, countries and activity”
- Top Customers: Logged in customers with the most tracked revenue in the period.
- Top Countries: Visitors per country, from your CDN’s country header or MaxMind.
- Activity Mix: The share of each kind of activity.