

How to Find Where Orders Slow Down
The bar promises customers a date. The dashboard shows whether you keep it, and which step to speed up.
Step 1: Open the dashboard
Section titled “Step 1: Open the dashboard”Go to DevDiggers Plugins → Order Progress Bar → Dashboard.
Step 2: Pick a period
Section titled “Step 2: Pick a period”The date menu at the top right sets the period. A longer one, such as Last 3 Months, smooths out one slow week.
Step 3: Read the fulfilment time
Section titled “Step 3: Read the fulfilment time”Avg. Fulfilment Time is the average time from the order being placed to your last step, for orders that finished in the period. The arrow compares it with the period before, and goes red when it got slower.

Step 4: Find the longest bar
Section titled “Step 4: Find the longest bar”Time to Reach Each Step shows the average time between the previous step and each one. On the demo, Shipped took the longest, about 2.2 days after Processing.
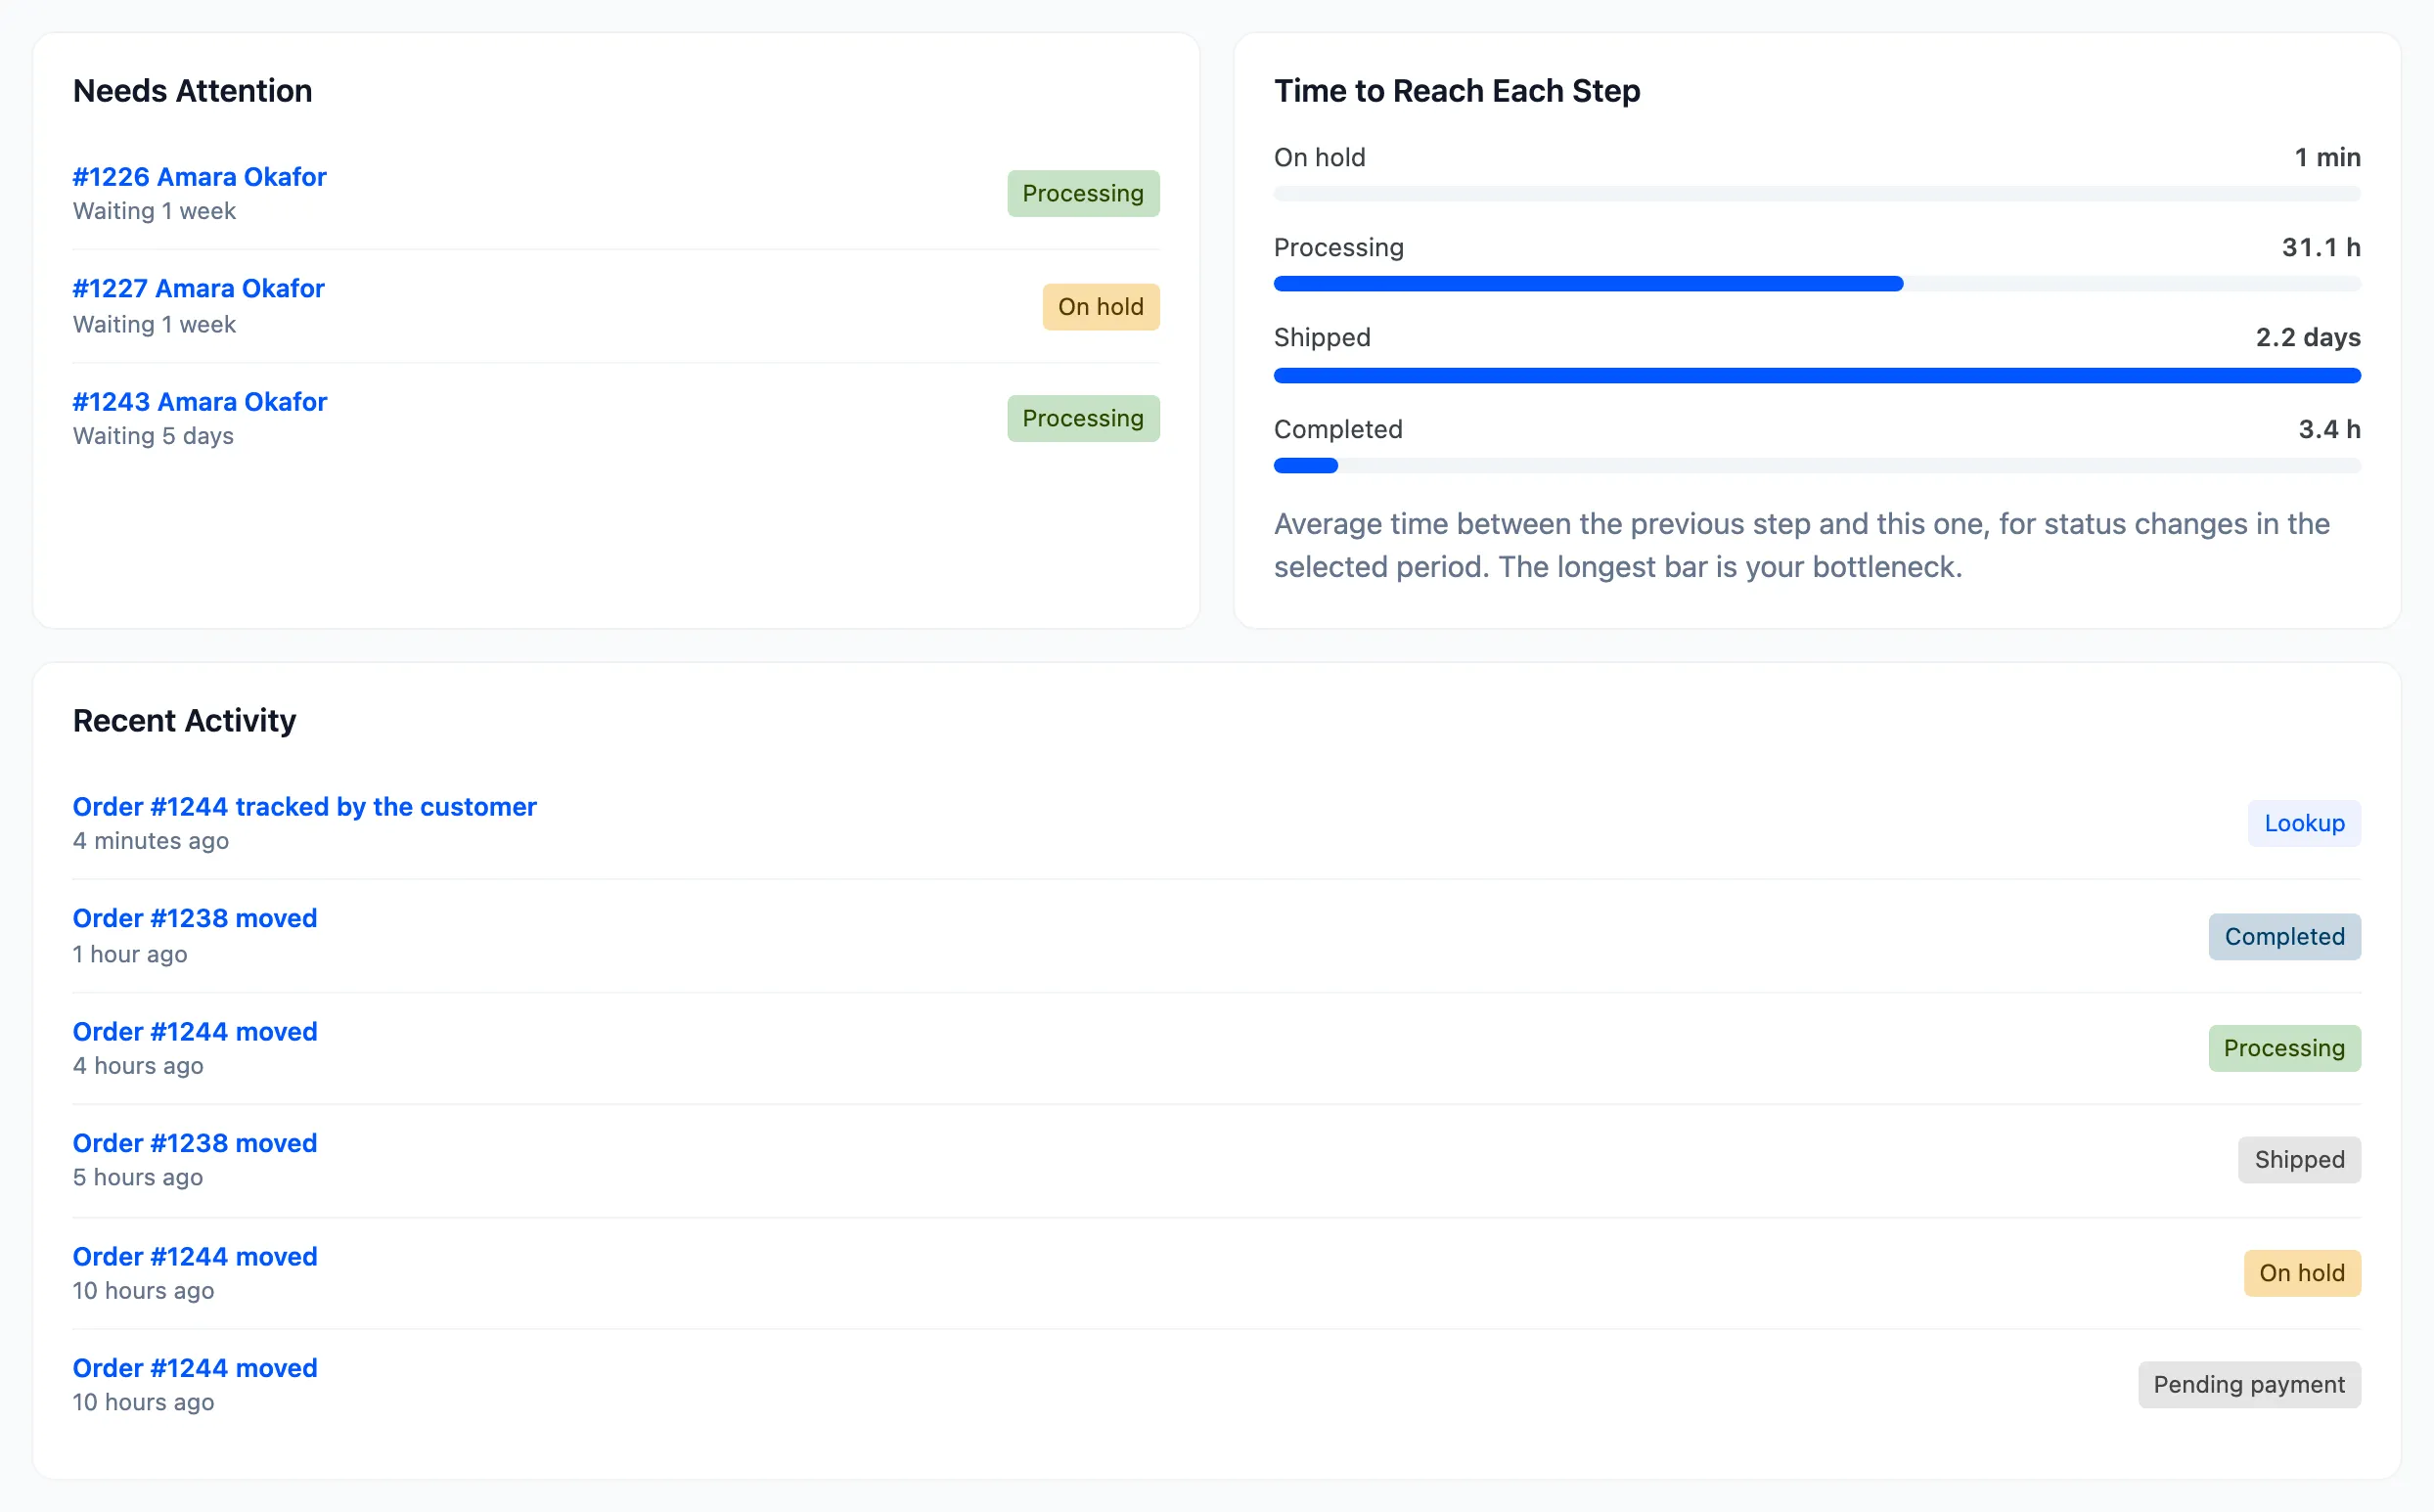
On hold at a minute is normal: bank transfer orders go on hold the moment they are placed. What counts is the step after it, the wait for the payment.
Step 5: Adjust the step days
Section titled “Step 5: Adjust the step days”Set each step’s Days to reach this step under Status Flow close to what the dashboard shows. The delivery estimate then promises what you can keep.
Good to know
Section titled “Good to know”- Only status changes in the period count. Orders from before the plugin was installed are left out until they move.
- Orders by Step shows where orders are waiting right now, which is a different question.