

How to Read Your AR View Analytics (Pro)
The numbers exist to answer one commercial question: is this worth doing for more products. Here is how to get an honest answer out of them.
Step 1: Turn tracking on
Section titled “Step 1: Turn tracking on”Go to DevDiggers Plugins → Product View in AR → Configuration → Analytics.
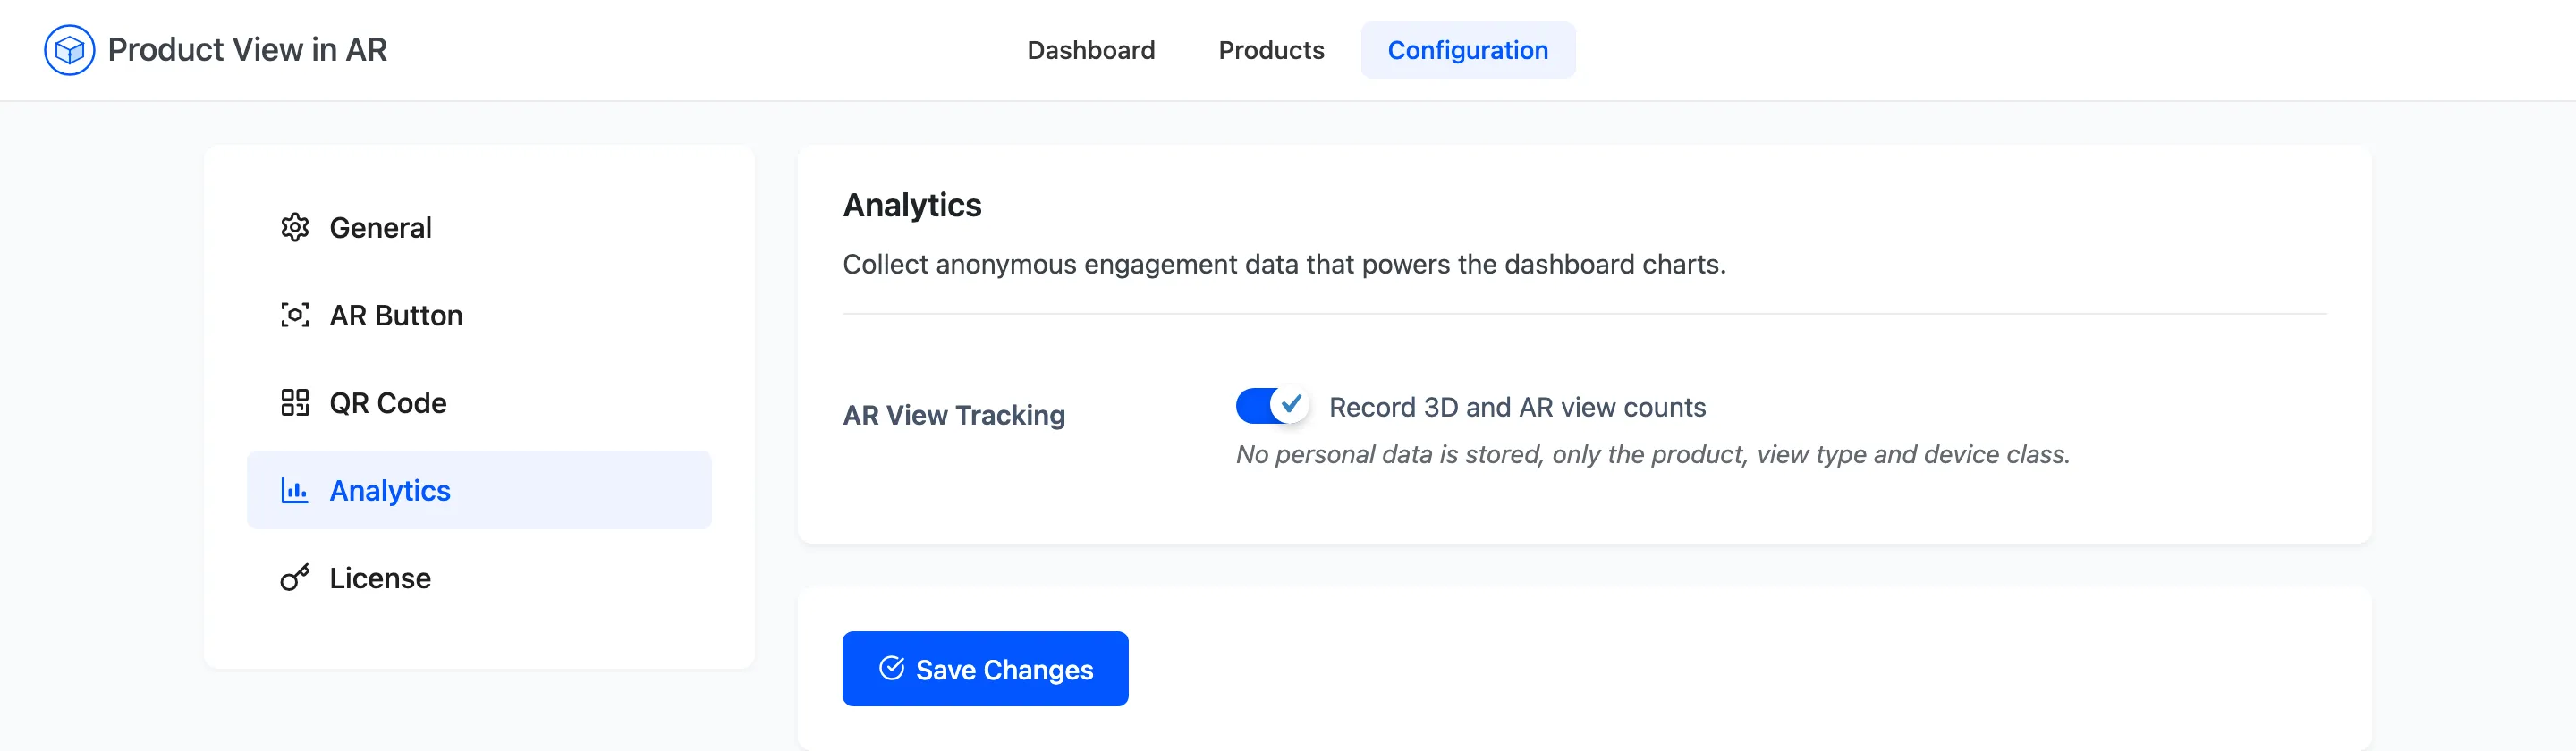
Tick Record 3D and AR view counts.
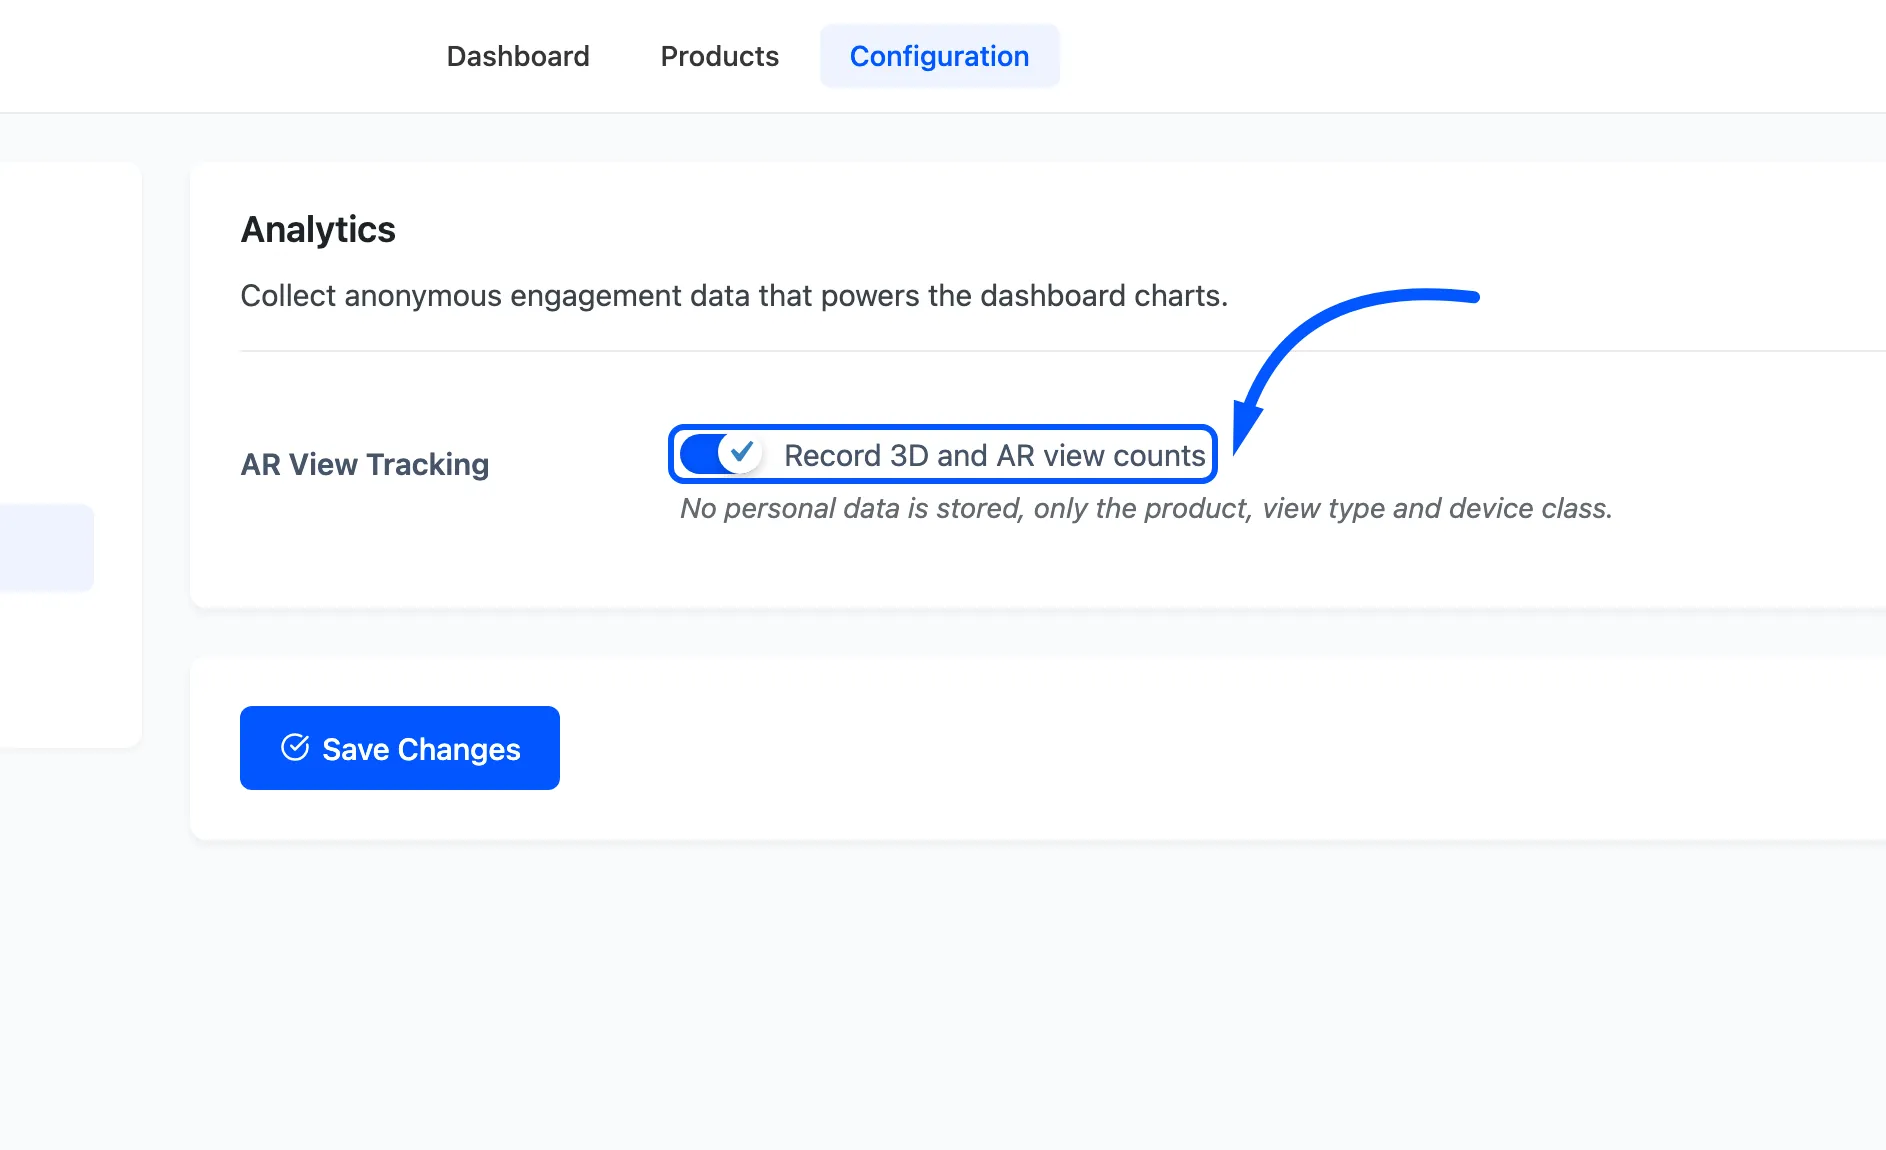
It is on by default. Each view stores the product, the view type, whether the device was mobile or desktop, and a random session id. No name, no email and no IP address, whether or not the shopper is logged in.
Press Save Changes.
Step 2: Confirm it is recording
Section titled “Step 2: Confirm it is recording”Open a product with a model on the storefront and press 3D View.
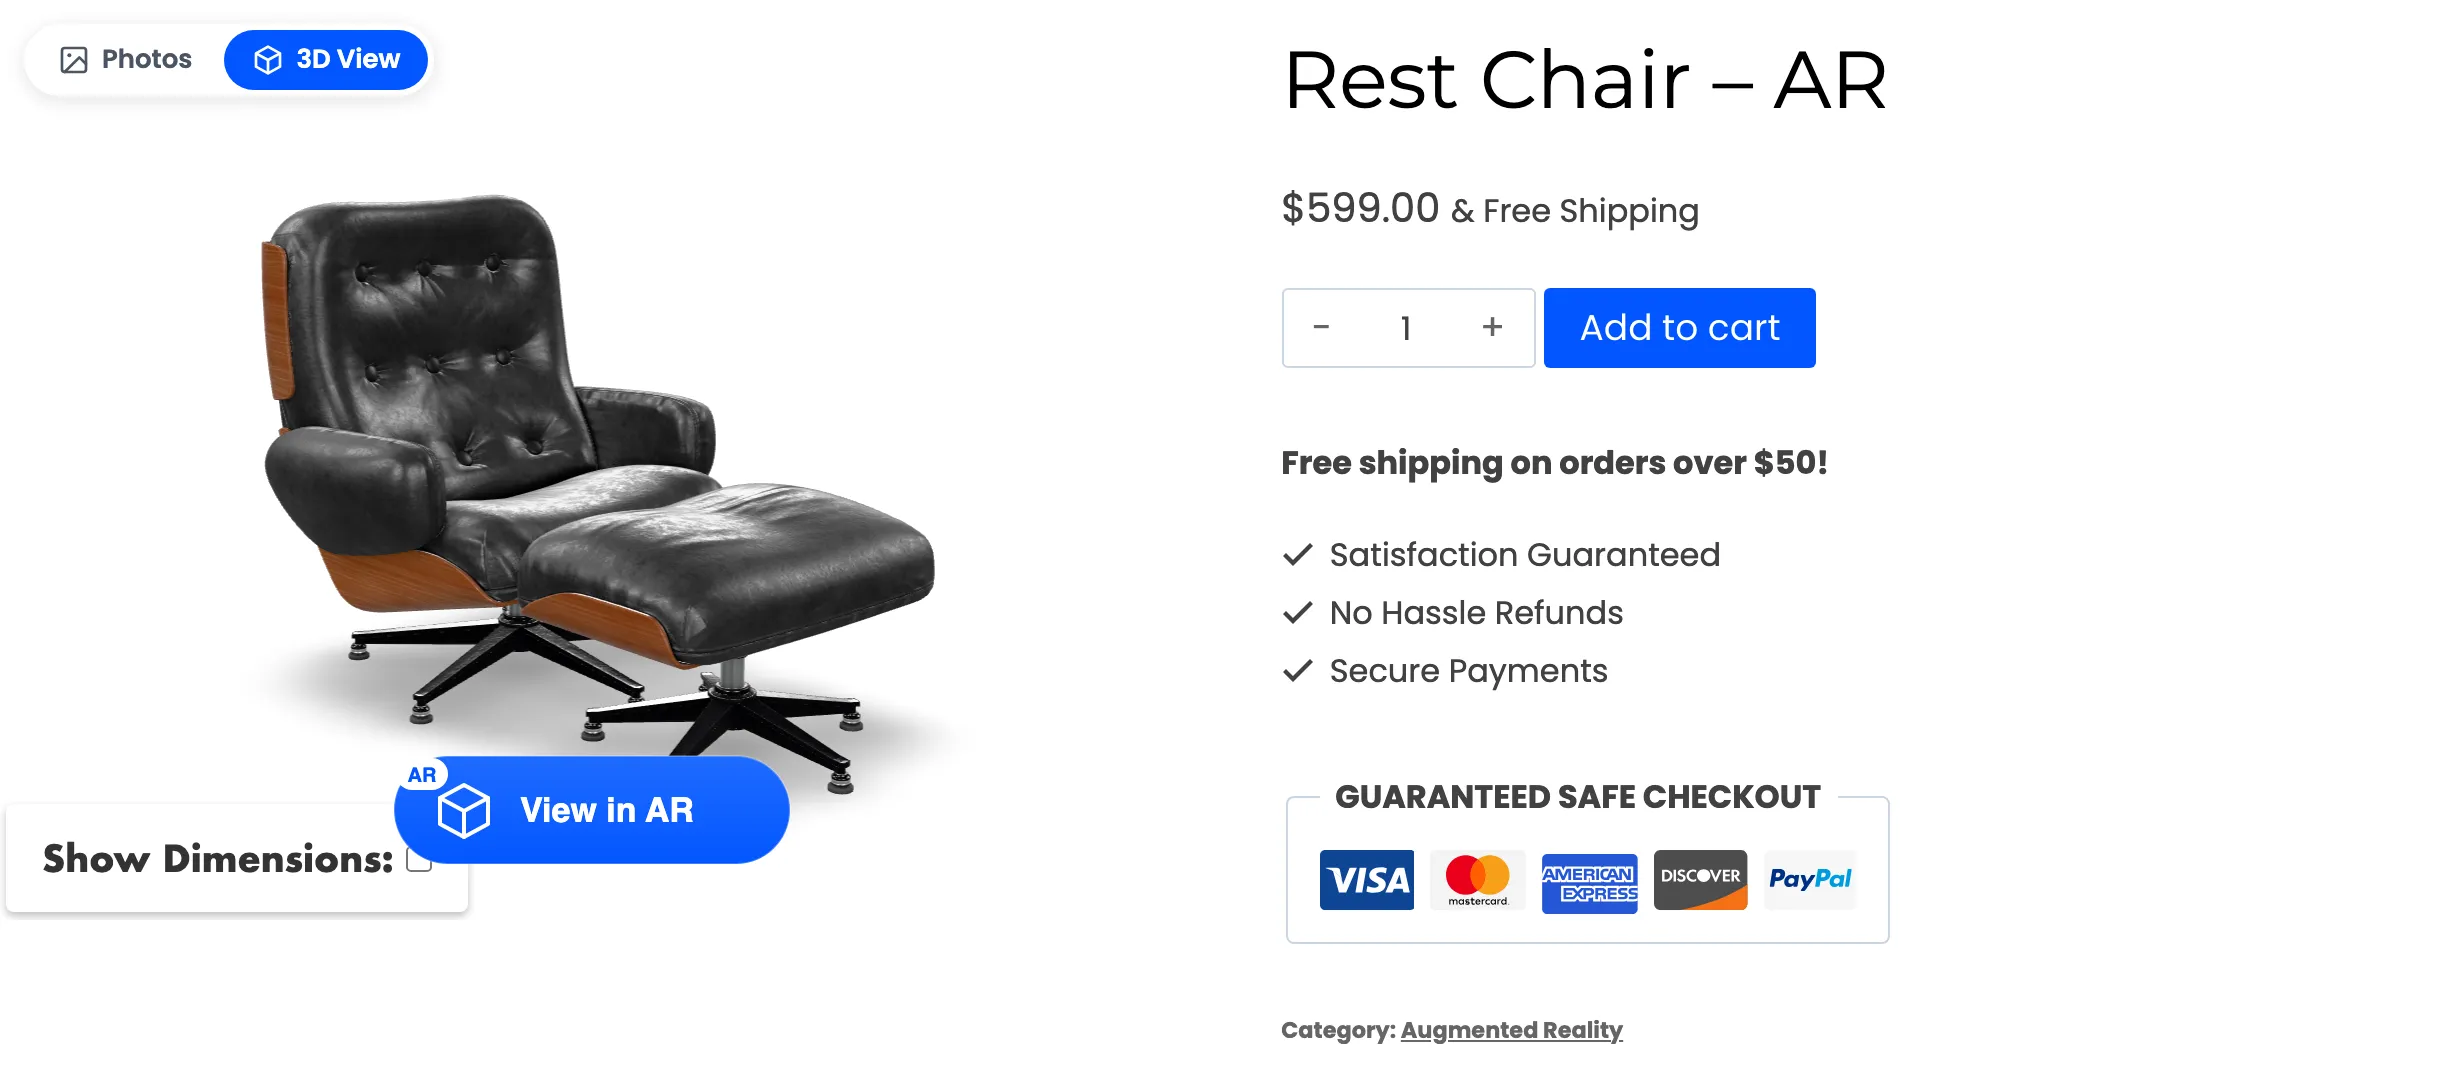
Then go to the dashboard and look at Recent Activity.
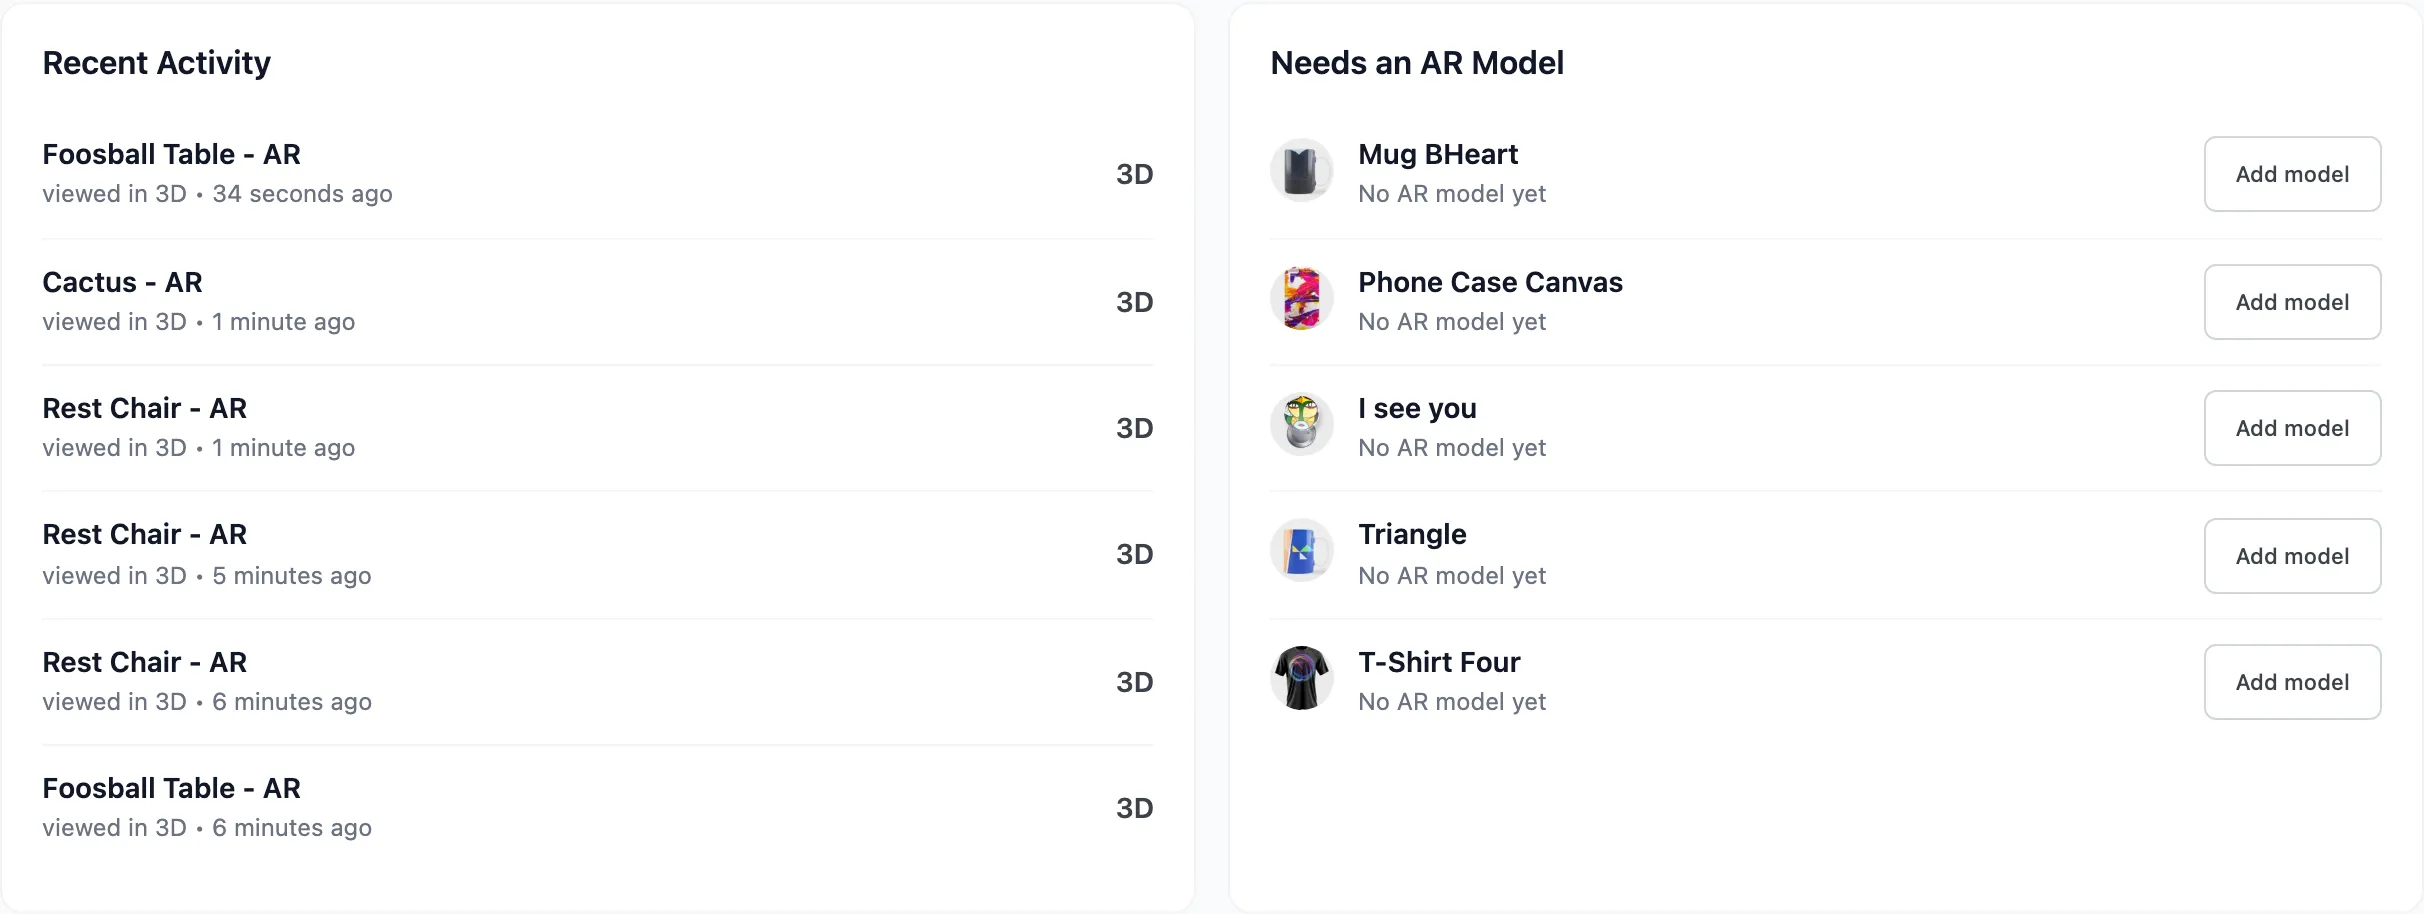
Your view appears as a sentence: the product, “viewed in 3D”, and how long ago. This is the check to run whenever the numbers look wrong, because it either shows a row or it does not.
Reload the same product and press 3D View again, and no second row appears. That is correct. A view is counted once per browser session per product per type, so the figures count people rather than clicks.
Step 3: Set a date range
Section titled “Step 3: Set a date range”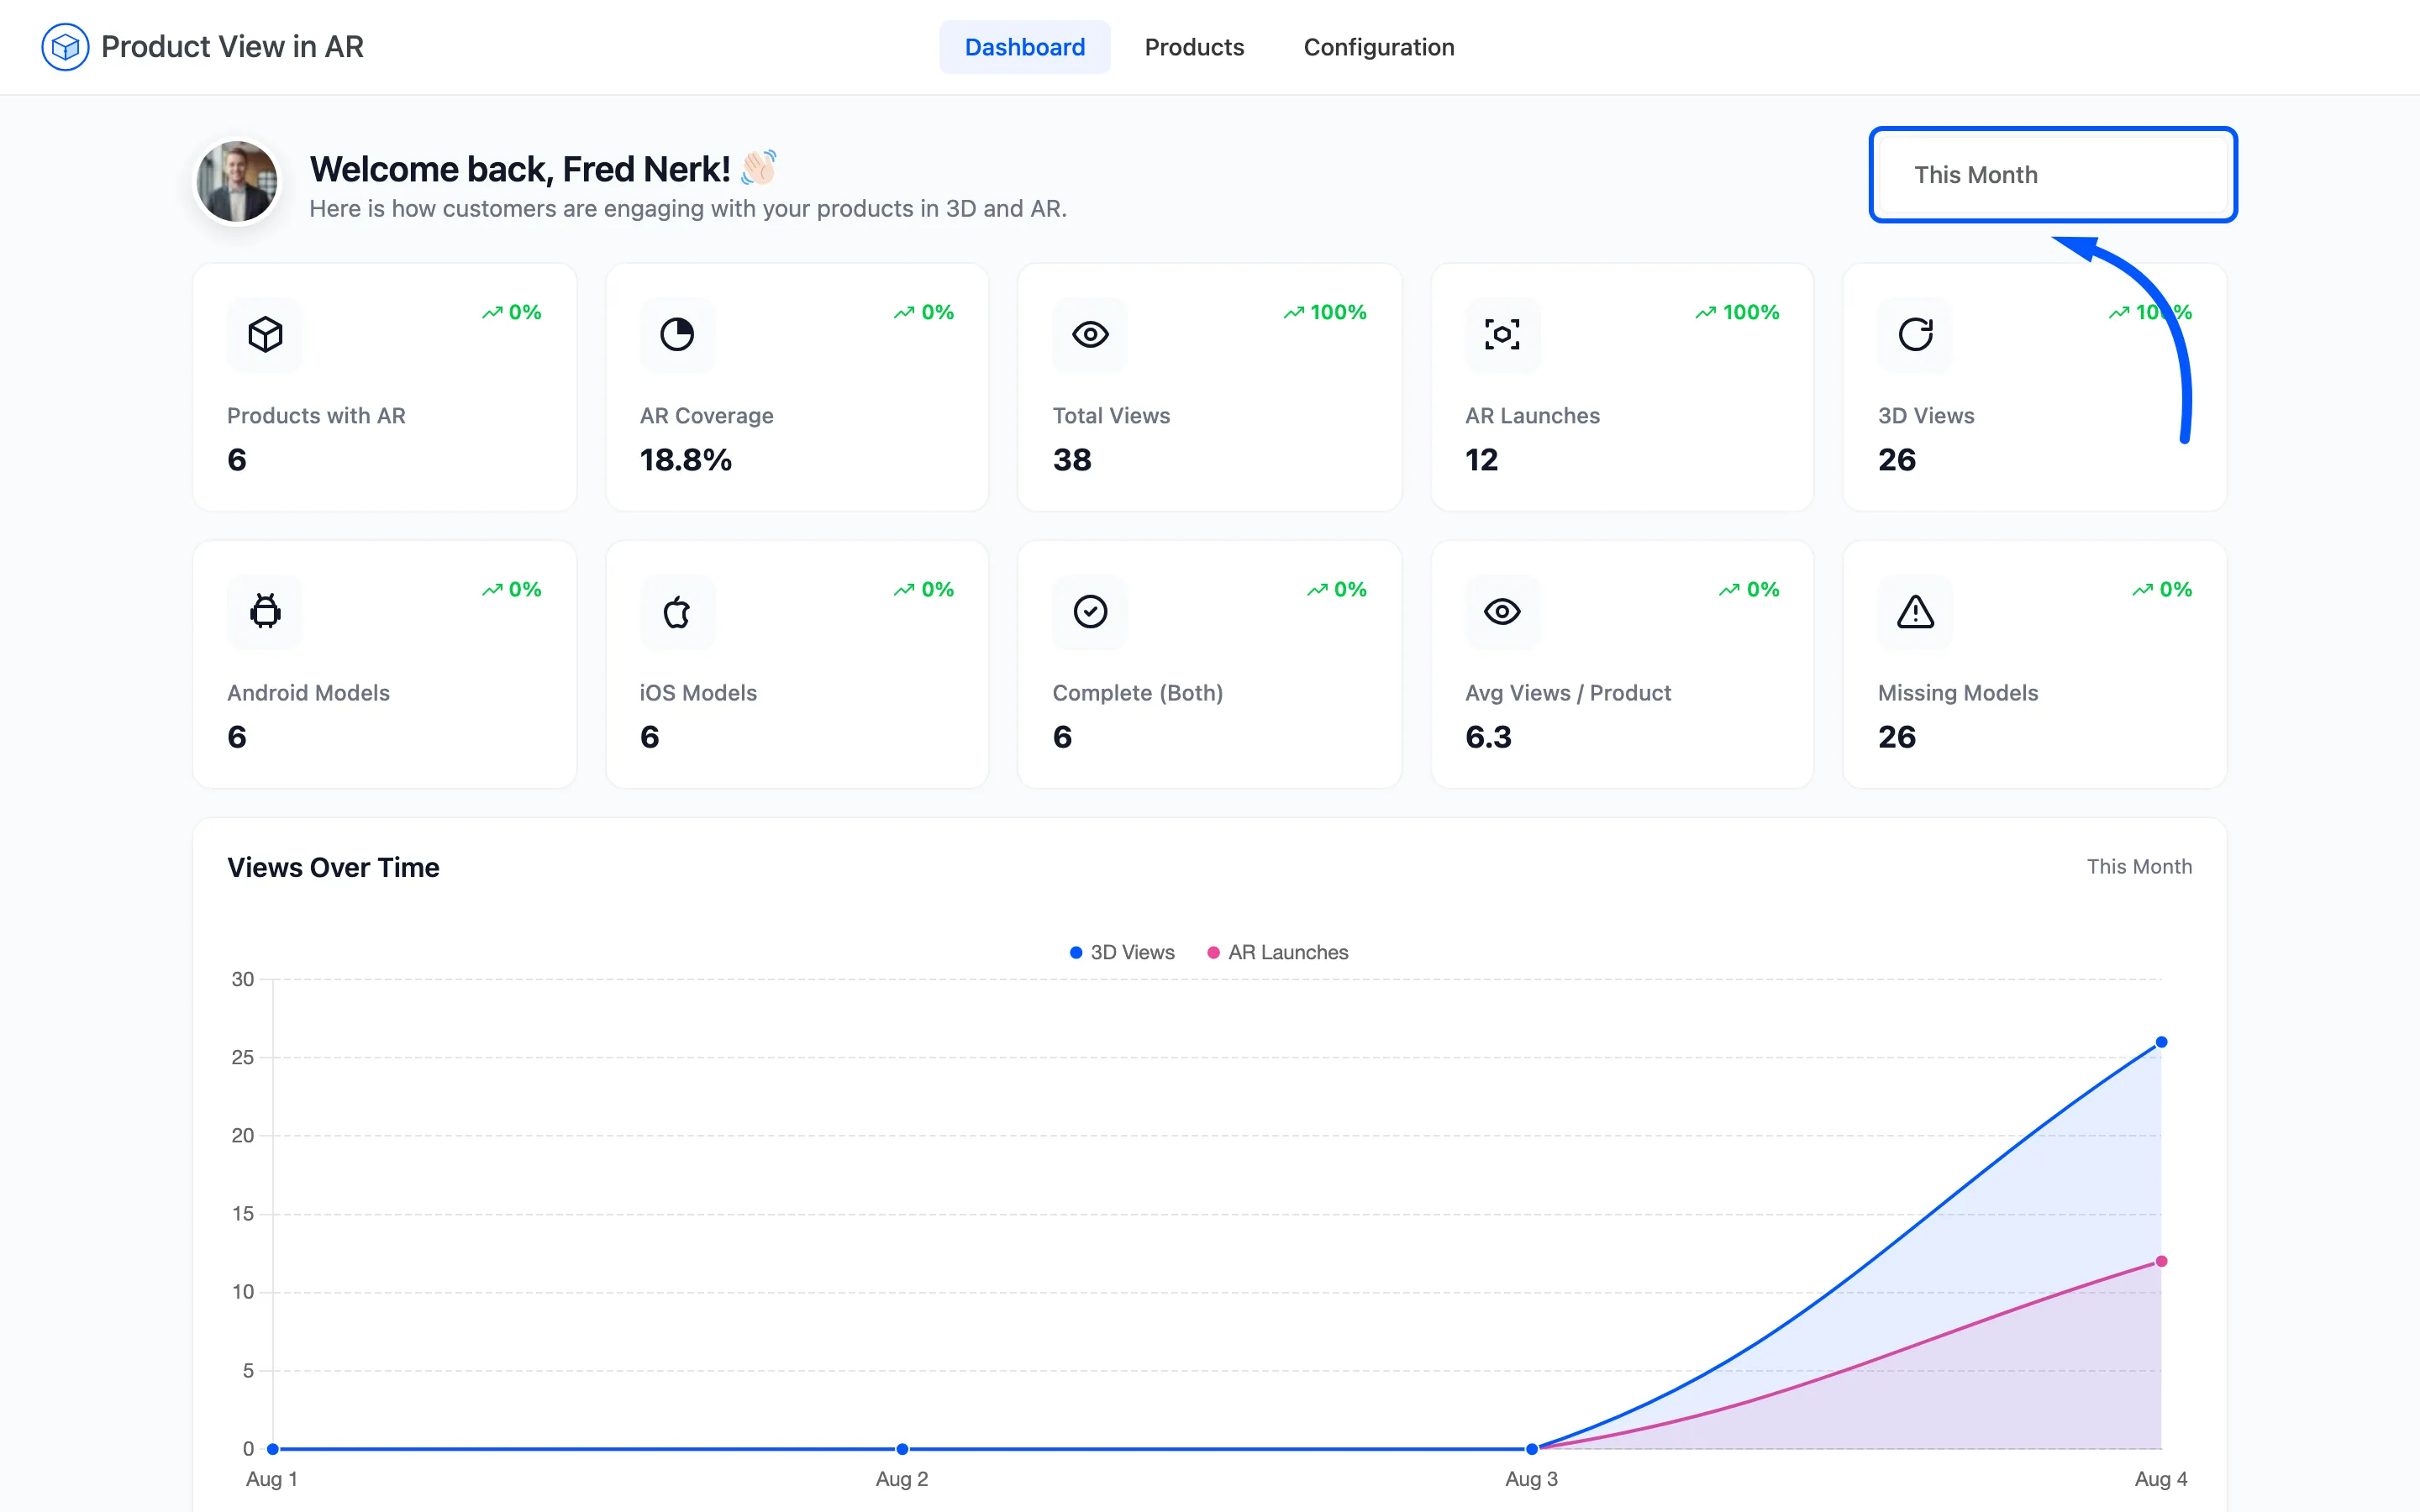
The picker at the top right drives every view number and all three charts. It offers presets plus a custom from and to date, and defaults to the last 30 days.
The coverage cards ignore it, because a product either has a model or it does not.
Step 4: Read the cards and the trend
Section titled “Step 4: Read the cards and the trend”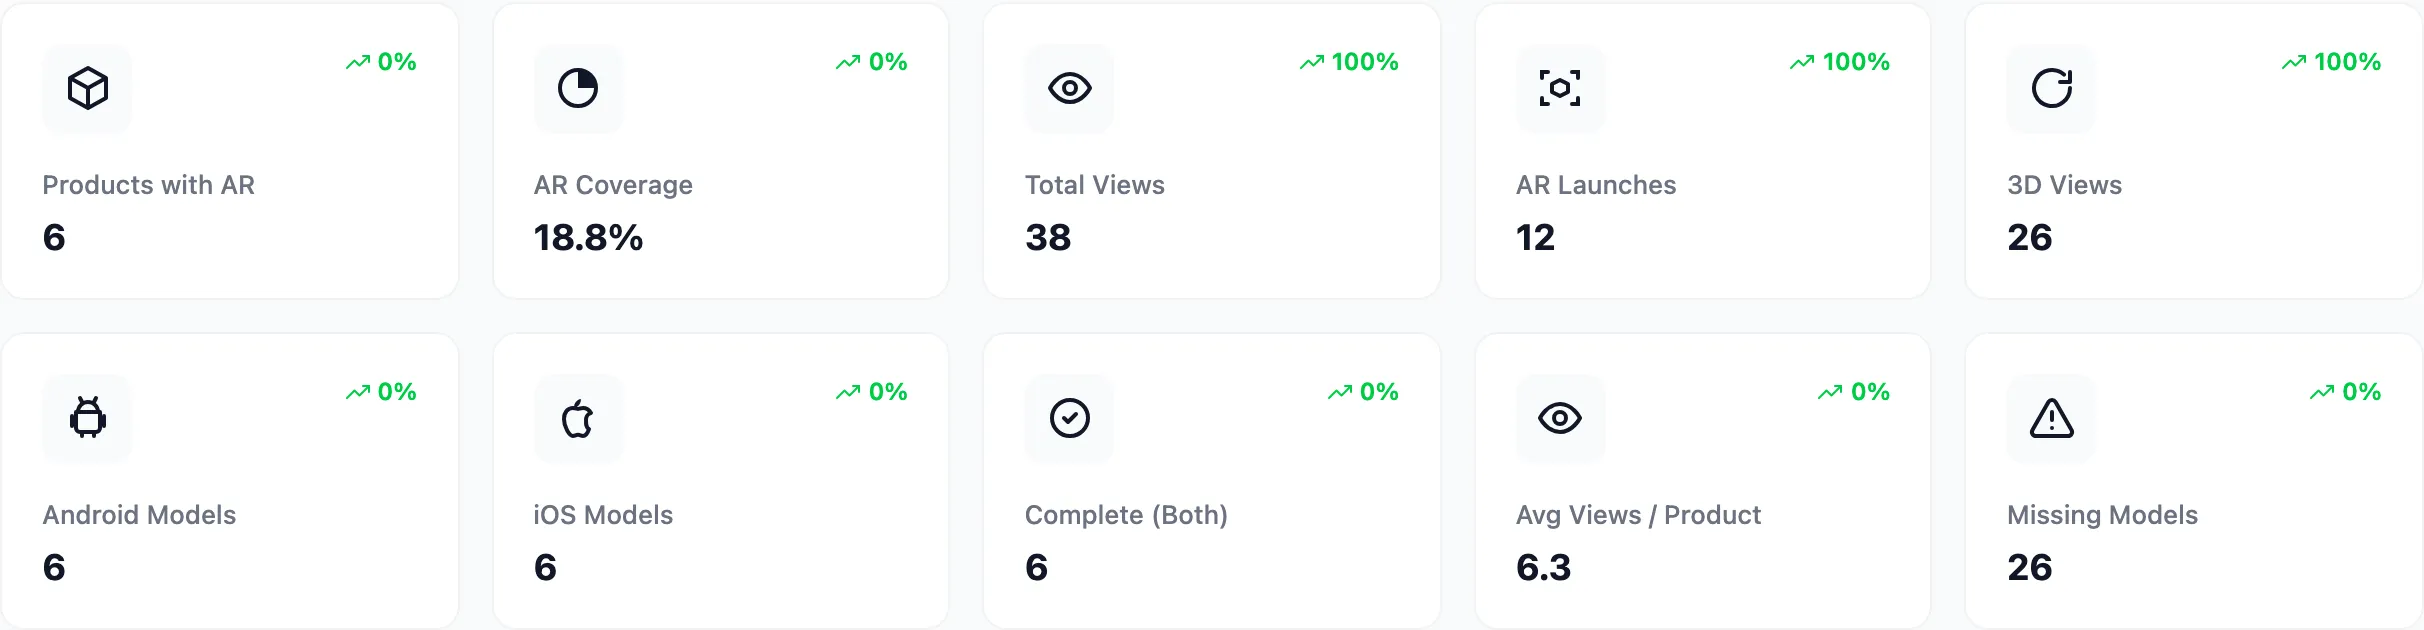
Four cards move with the range: Total Views, AR Launches, 3D Views and Avg Views / Product. The percentage on the first three compares the range with the period immediately before it, of equal length.
Avg Views / Product is the one that decides the business case. Total views rise simply because you added models. The average tells you whether those models are being used.
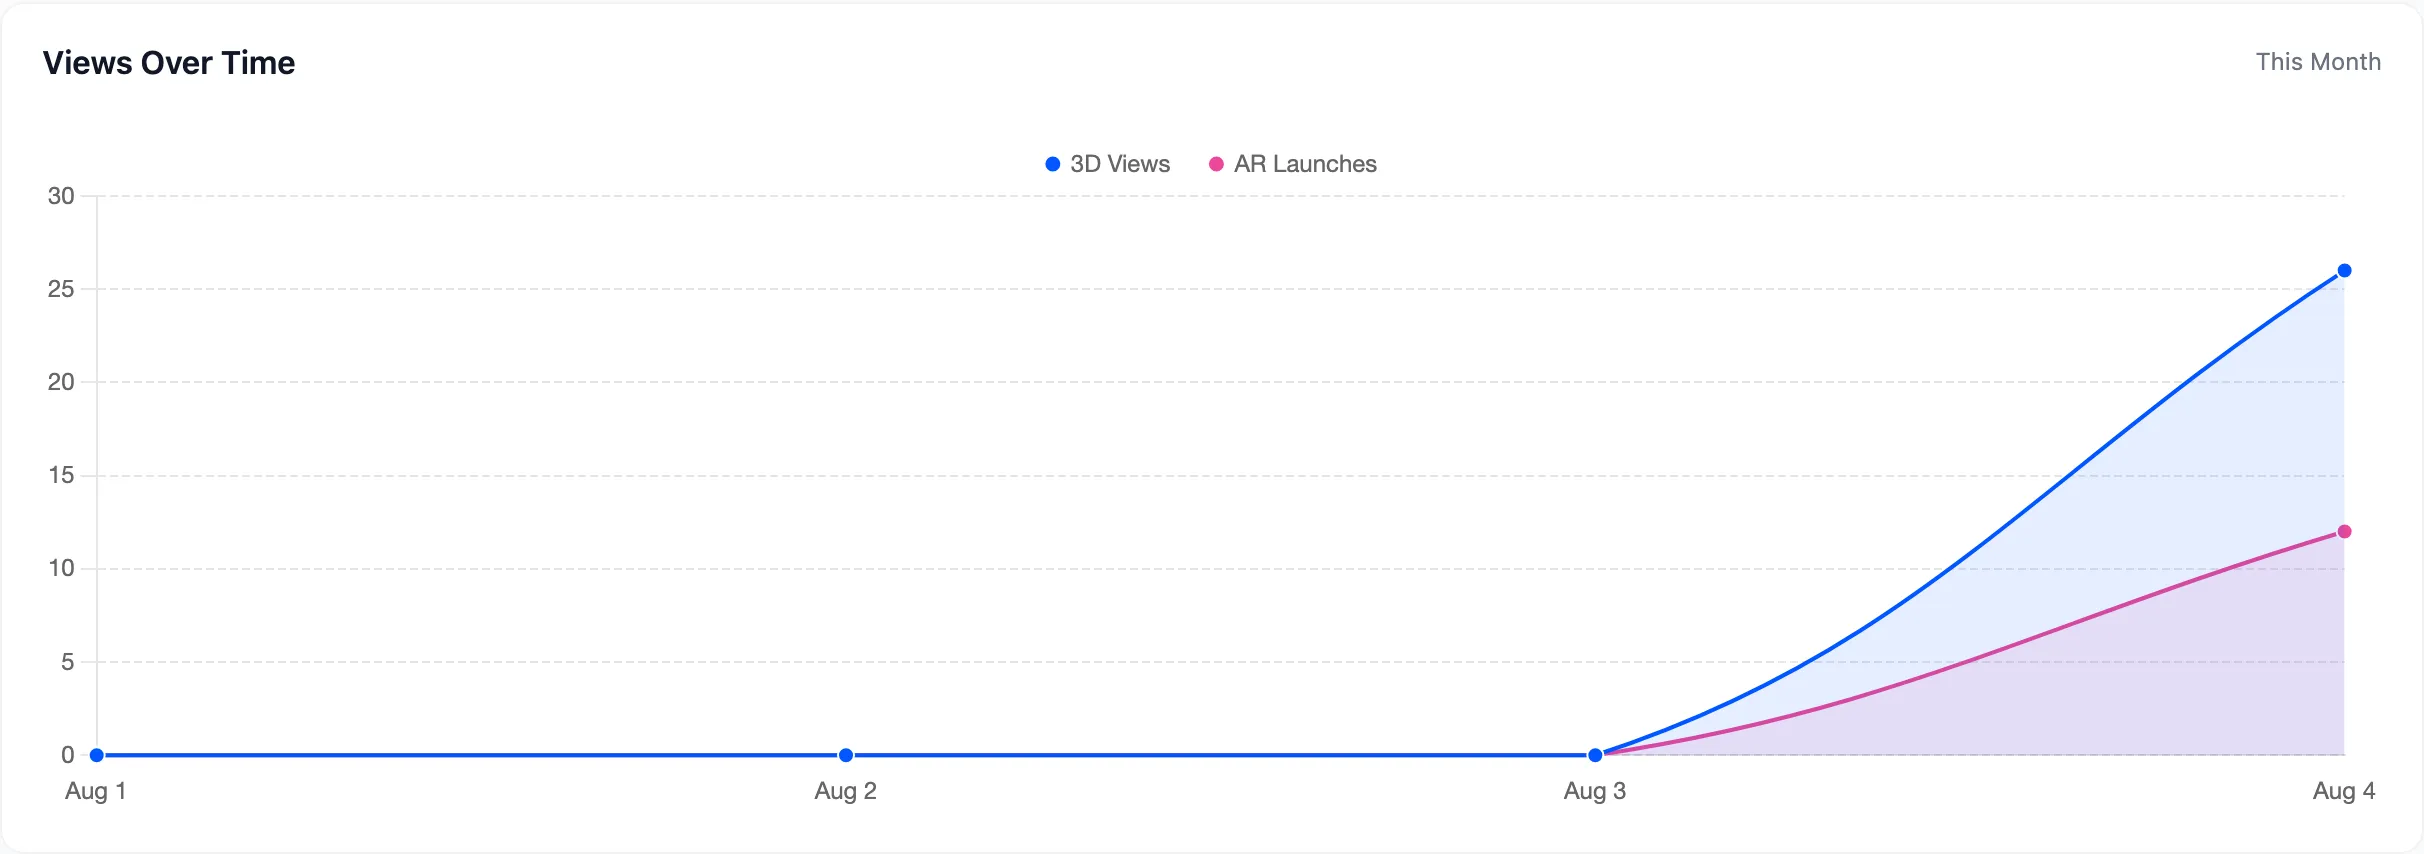
The trend chart plots 3D Views and AR Launches together, and the gap between the lines is the interesting part. Plenty of 3D and almost no AR usually means desktop traffic that never crossed to a phone. That is a QR hand-off problem rather than a model problem.
Step 5: Read the two breakdowns
Section titled “Step 5: Read the two breakdowns”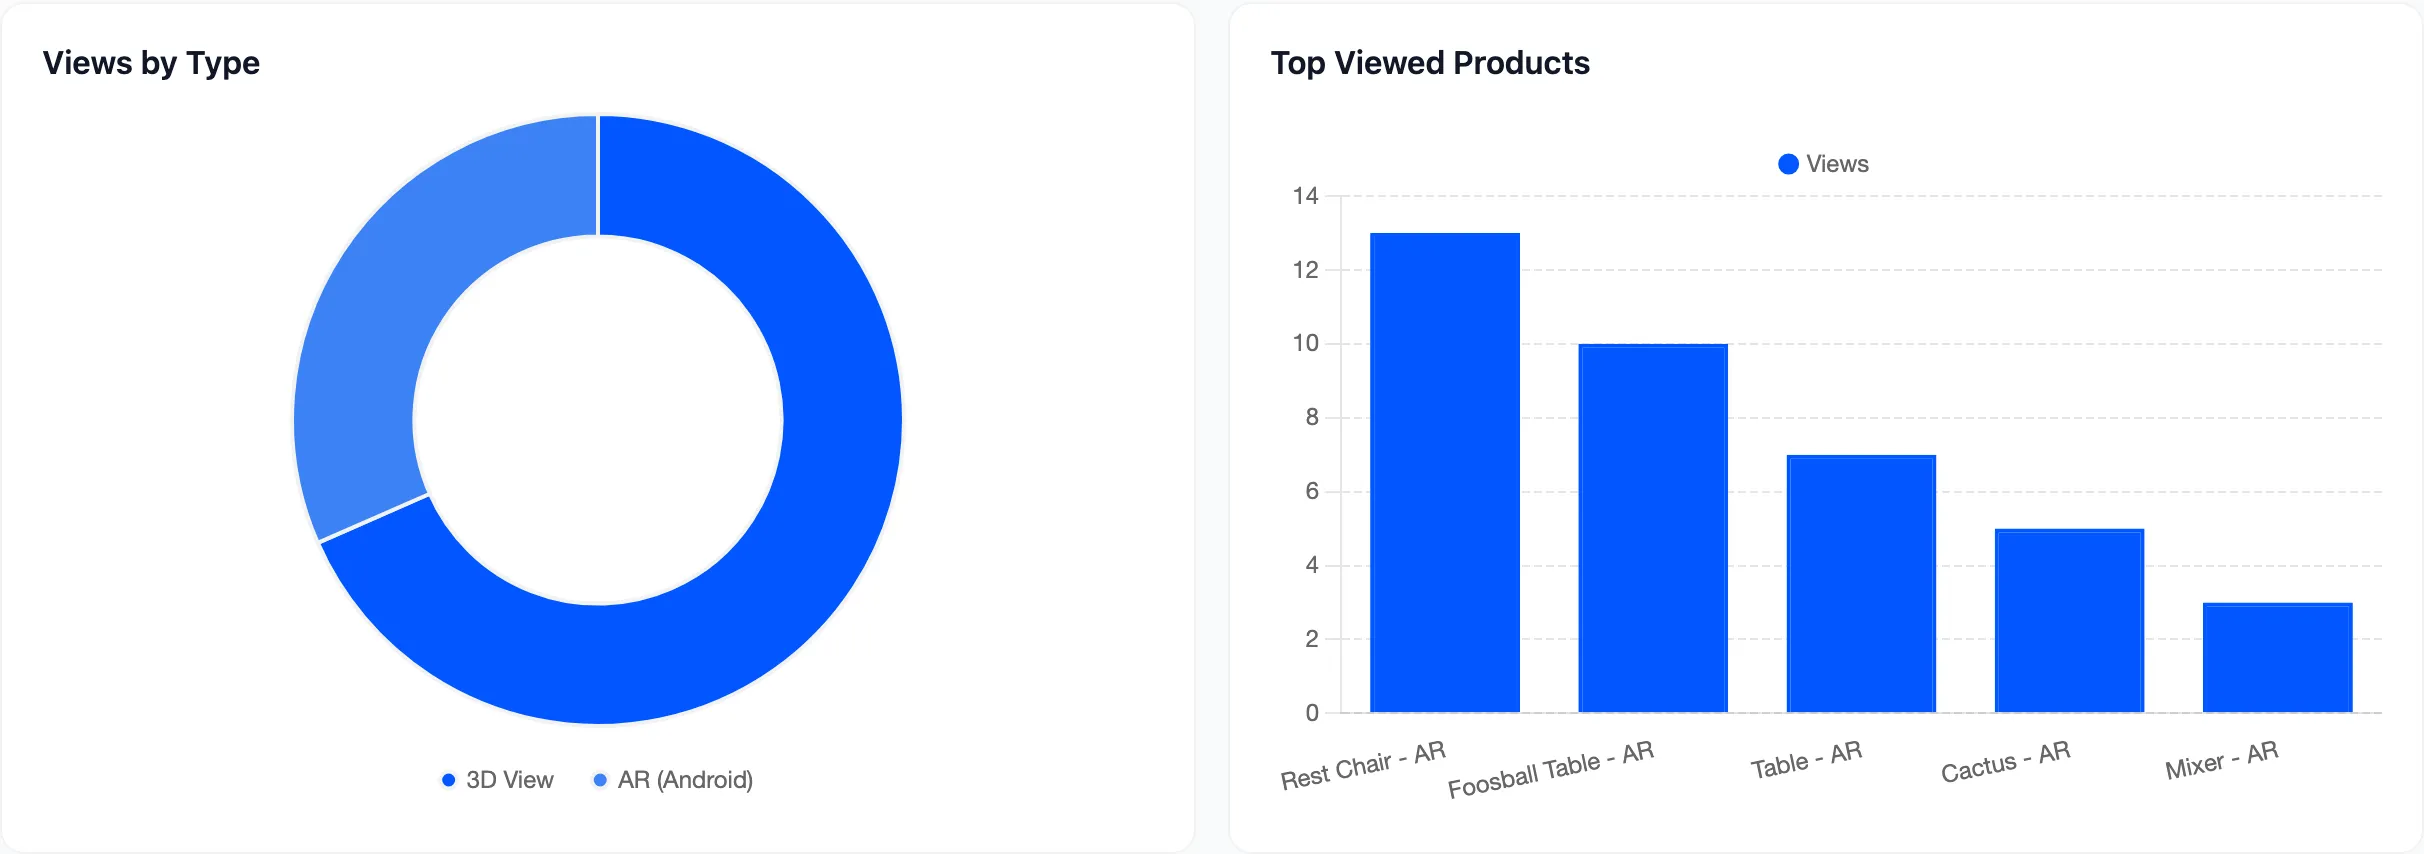
Views by Type splits the same total into 3D View, AR (Android) and AR (iOS). Two readings worth acting on:
- Almost all 3D. Either your traffic is desktop-heavy and the QR hand-off is off, or your caption is not persuading anyone to scan. Start with the QR code.
- AR (Android) with almost no AR (iOS): Usually means
.usdzfiles are missing, not that your customers all use Android. Check the Android Models and iOS Models cards, which should be equal.
Top Viewed Products ranks your seven most-viewed products. This is the list to work from when choosing the next model. The catalogue neighbours of a heavily-viewed product are being looked at by the same shoppers.
Tying it to money
Section titled “Tying it to money”The plugin does not report revenue, so this last part happens outside it and has no screen of its own.
Take the products at the top of that chart and check two things in WooCommerce for the same date range. Their conversion rate against the store average, and their return rate before and after the model went live.
For furniture and homeware the return rate is usually where the change shows up first. “It did not fit” stops being a surprise on delivery day.