

How to Find Products Missing an AR Model
Rolling AR out across a catalogue is a queue, not a project. This is how to see the queue, work it, and know when it is empty.
Step 1: Read your coverage
Section titled “Step 1: Read your coverage”Go to DevDiggers Plugins → Product View in AR → Dashboard.
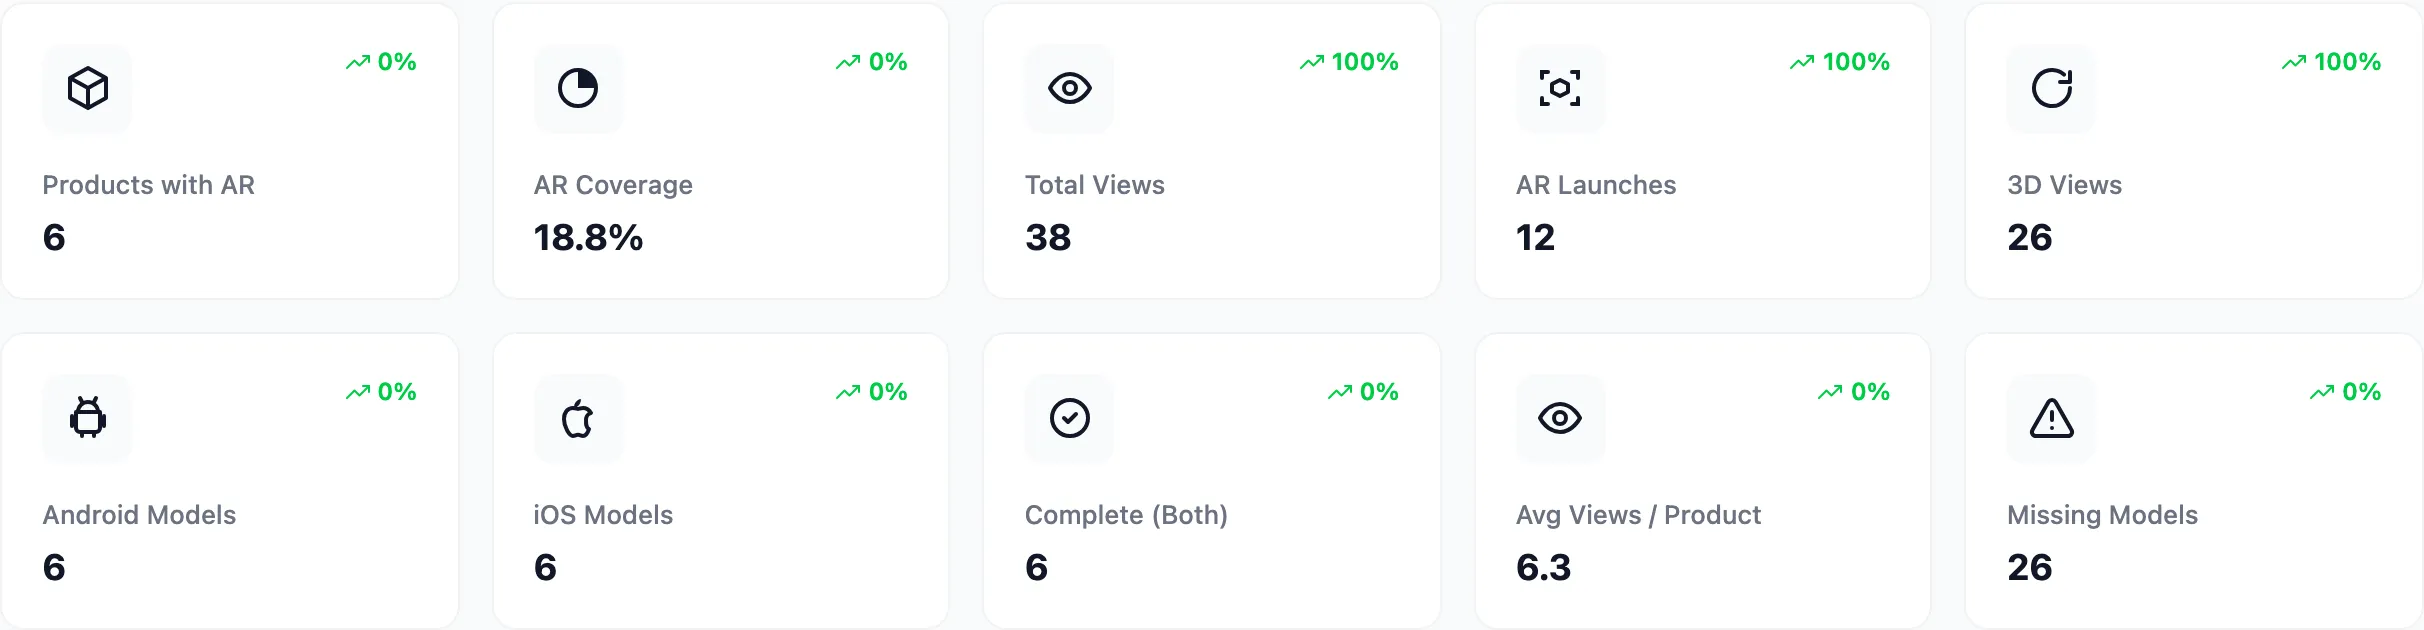
Three of the ten cards are the whole picture.
- AR Coverage is the percentage of published products carrying at least one model. This is the number to watch week to week.
- Missing Models is the count with neither file. This is the size of the queue.
- Complete (Both) is the count with a
.glband a.usdz. This is the number that should eventually equal Products with AR, and the gap between them is your half-done work.
None of these move with the date filter. A product either has a model or it does not.
Step 2: Work the shortlist
Section titled “Step 2: Work the shortlist”At the foot of the dashboard, Needs an AR Model lists five products with nothing attached.
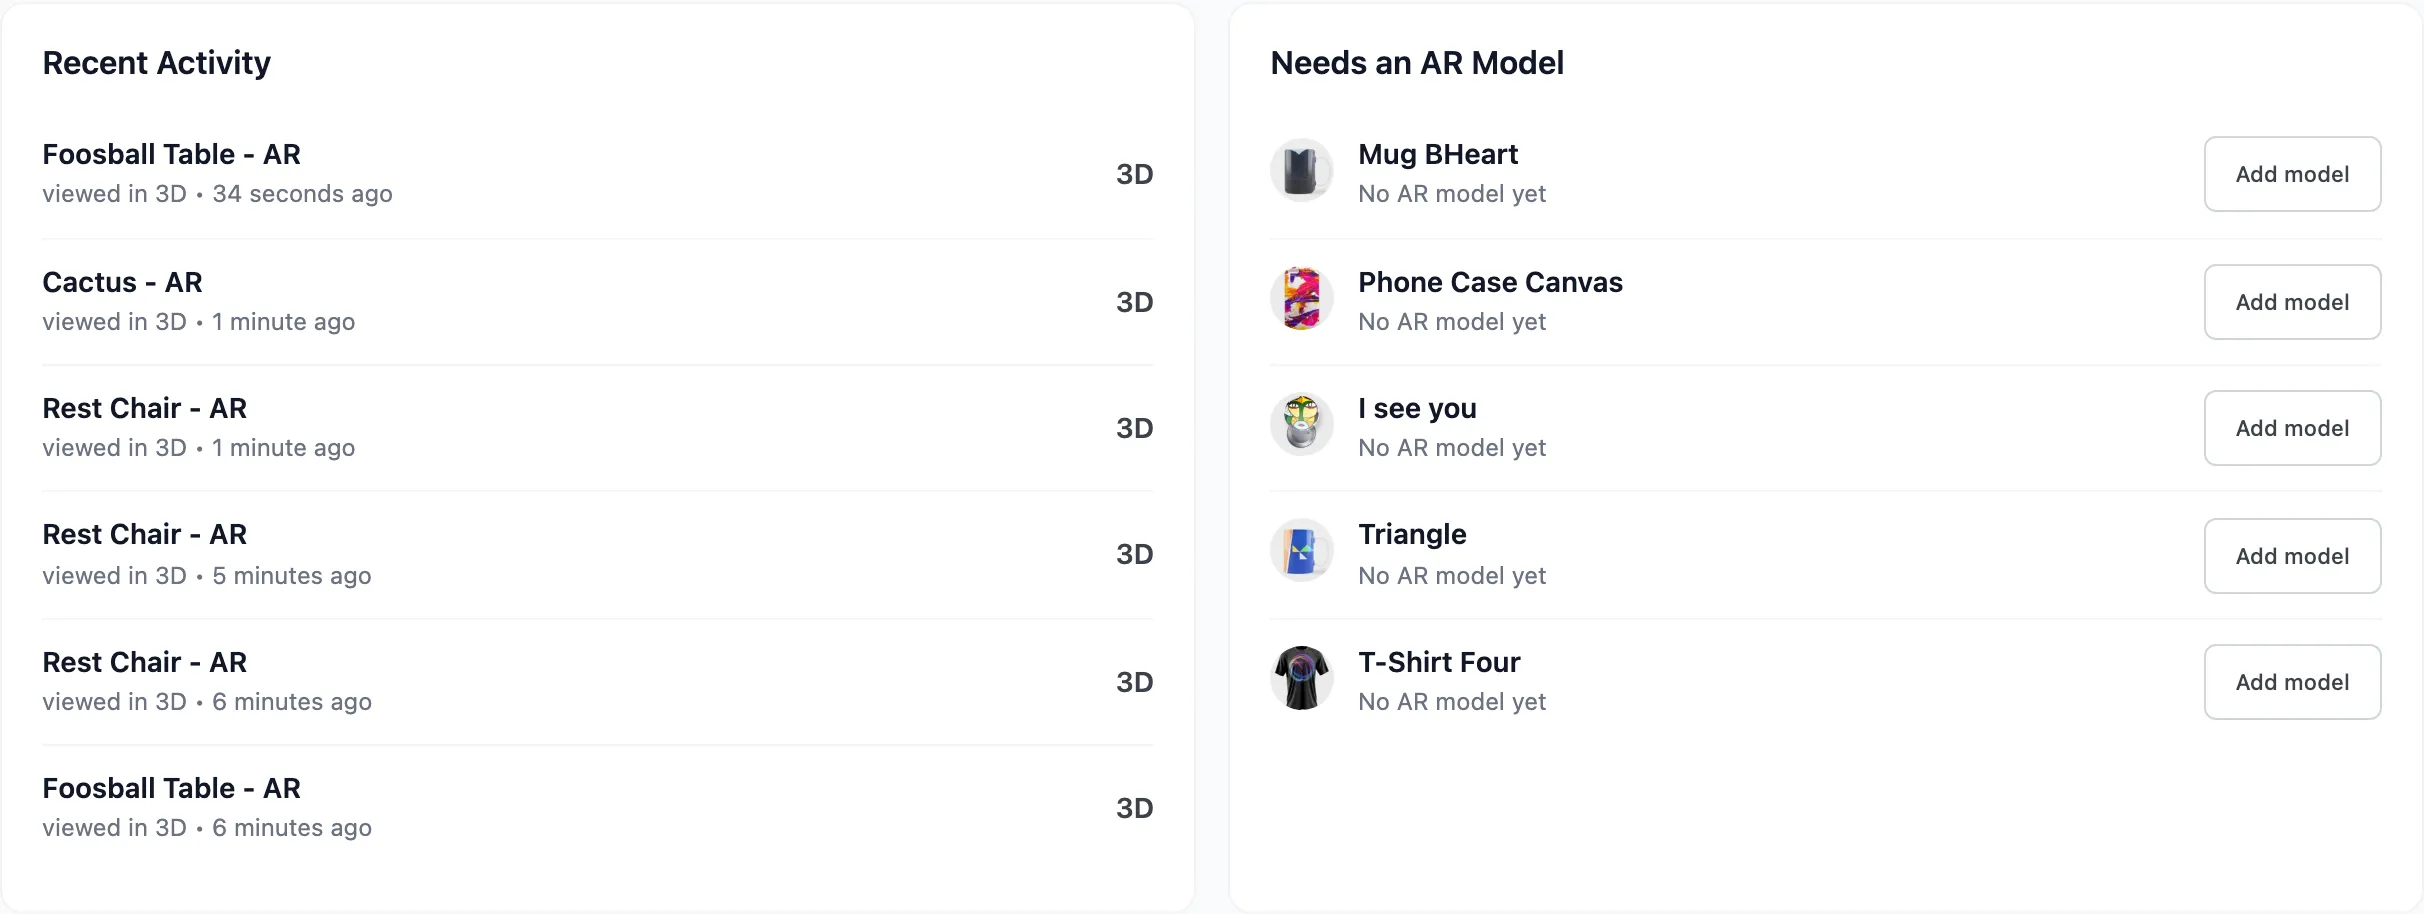
Each row has an Add model button.
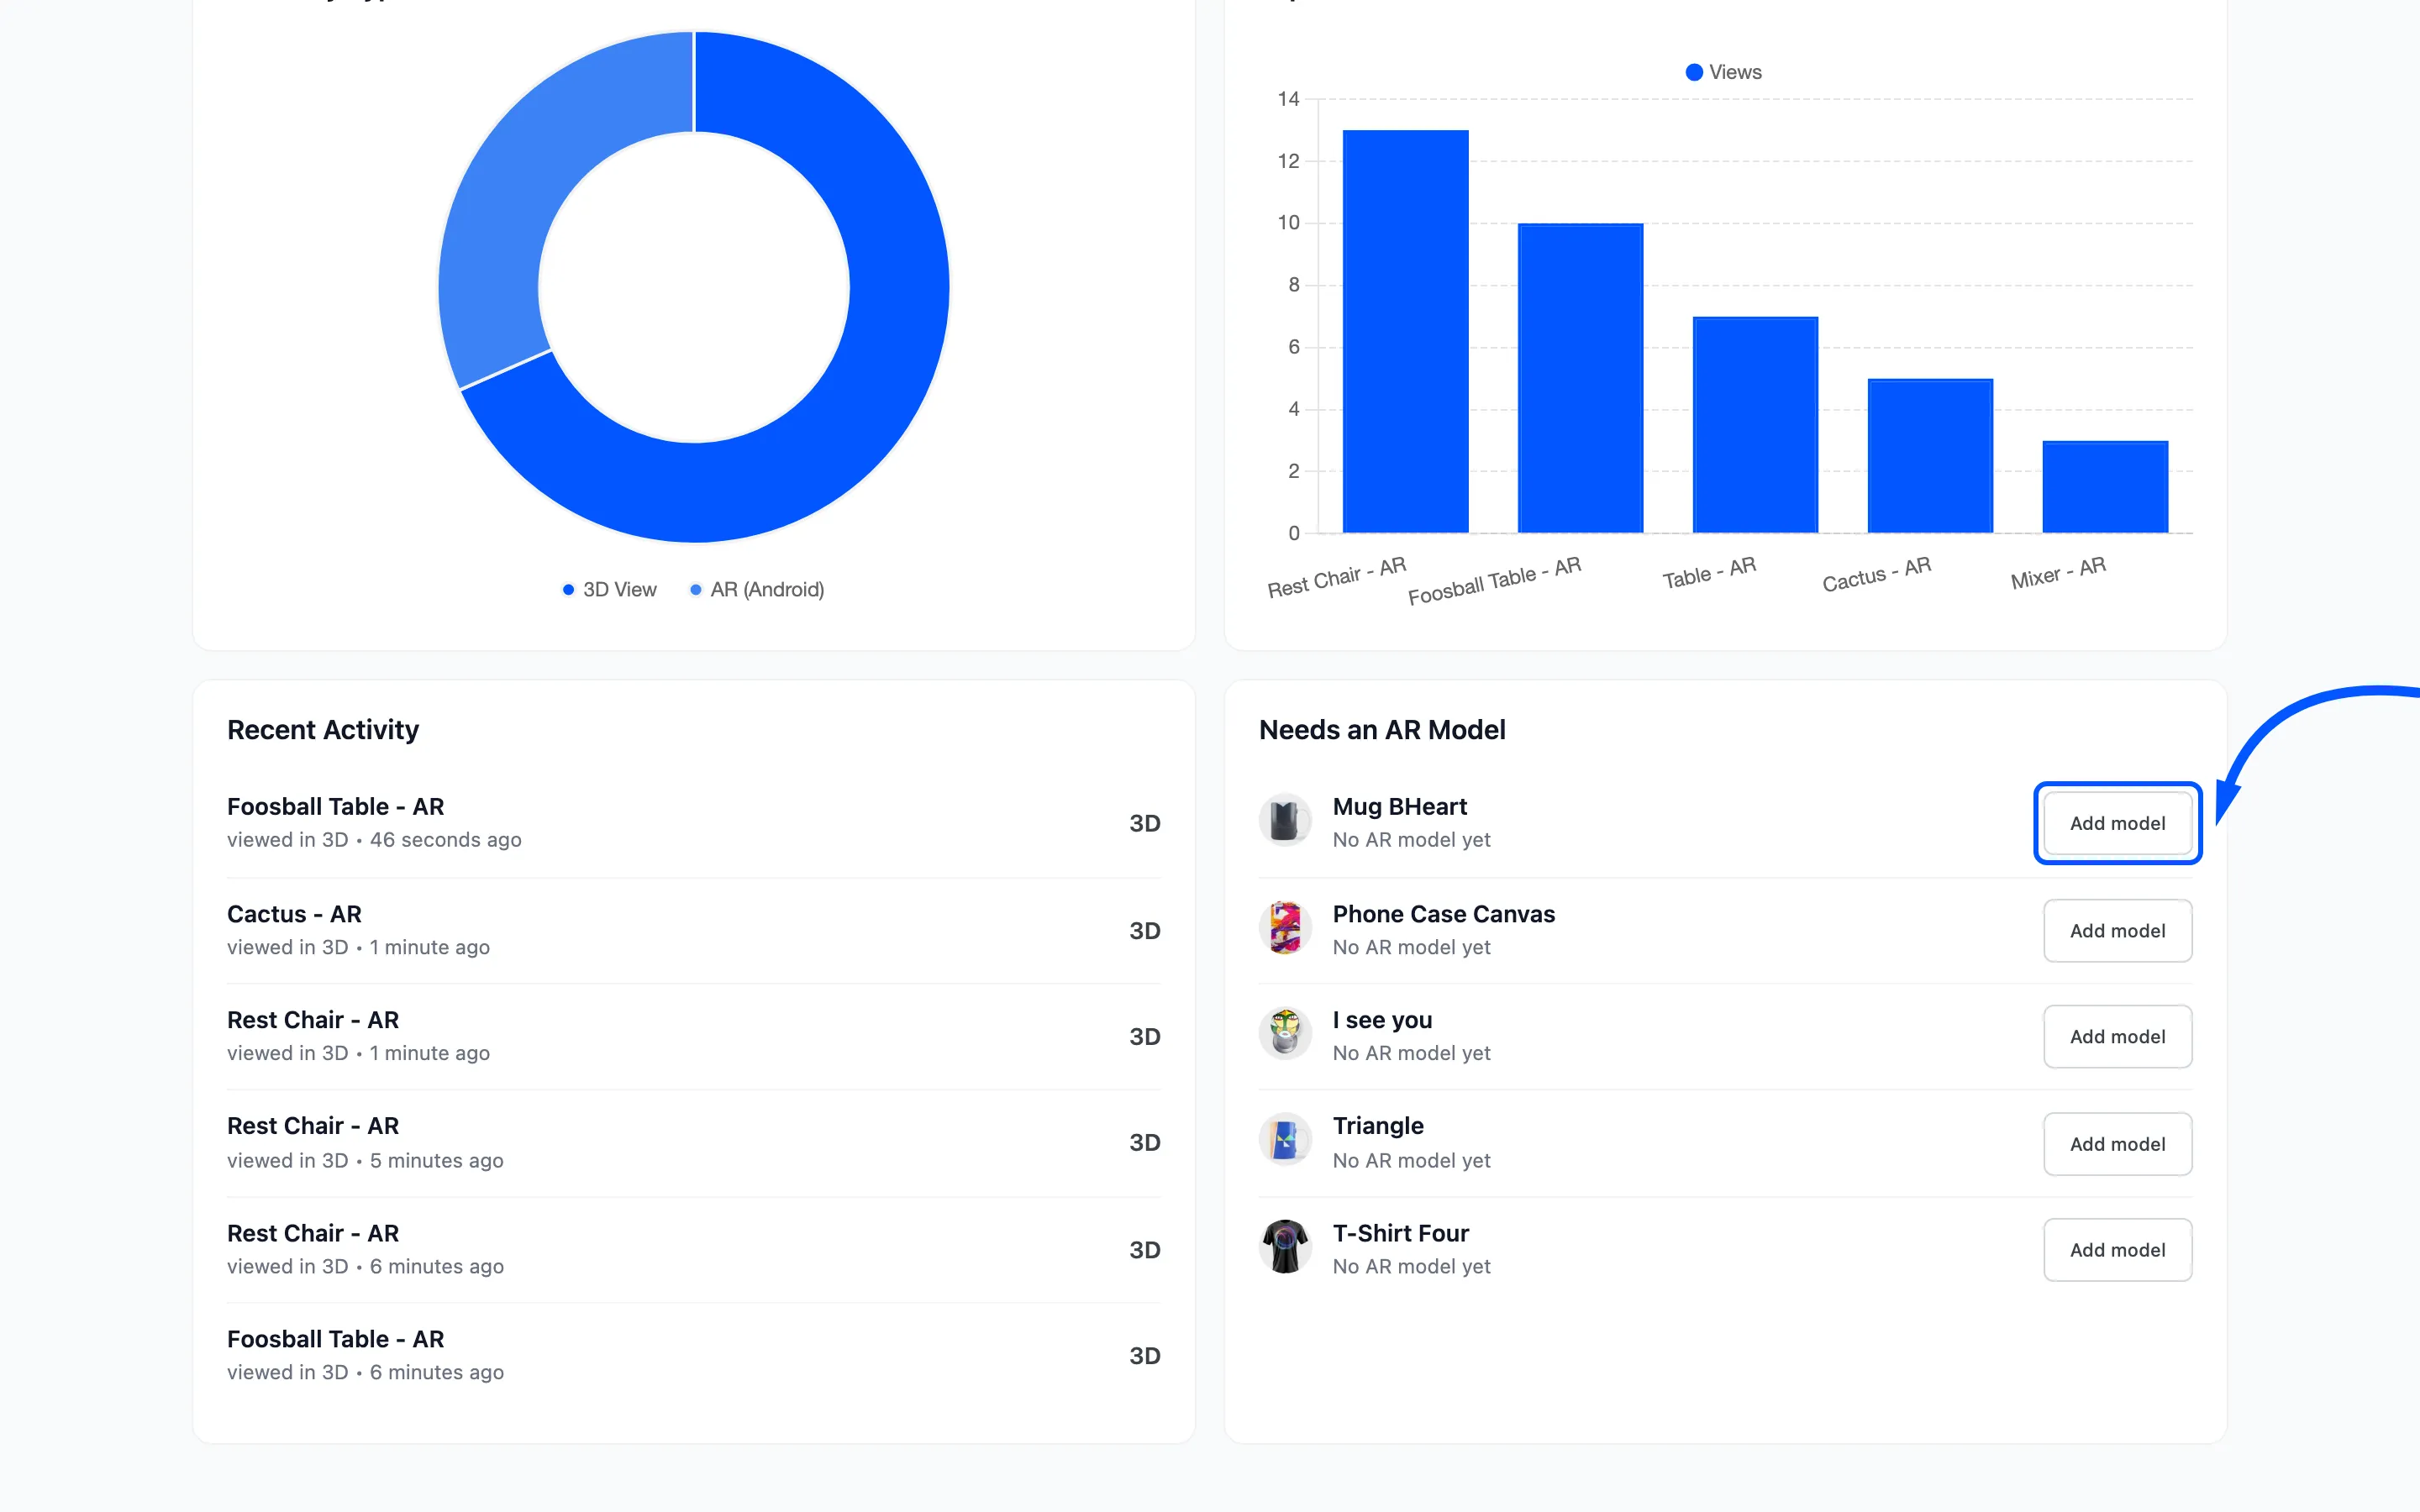
That button is the fast path. It opens the Products screen filtered to that one product, so the upload controls are the only thing on screen. Attach the files, go back to the dashboard, and the widget has refilled with the next five.
For a small catalogue that loop alone will finish the job.
Step 3: Filter the full list
Section titled “Step 3: Filter the full list”For a bigger catalogue, work from the list instead. Go to Products and set the filter to Missing AR model.
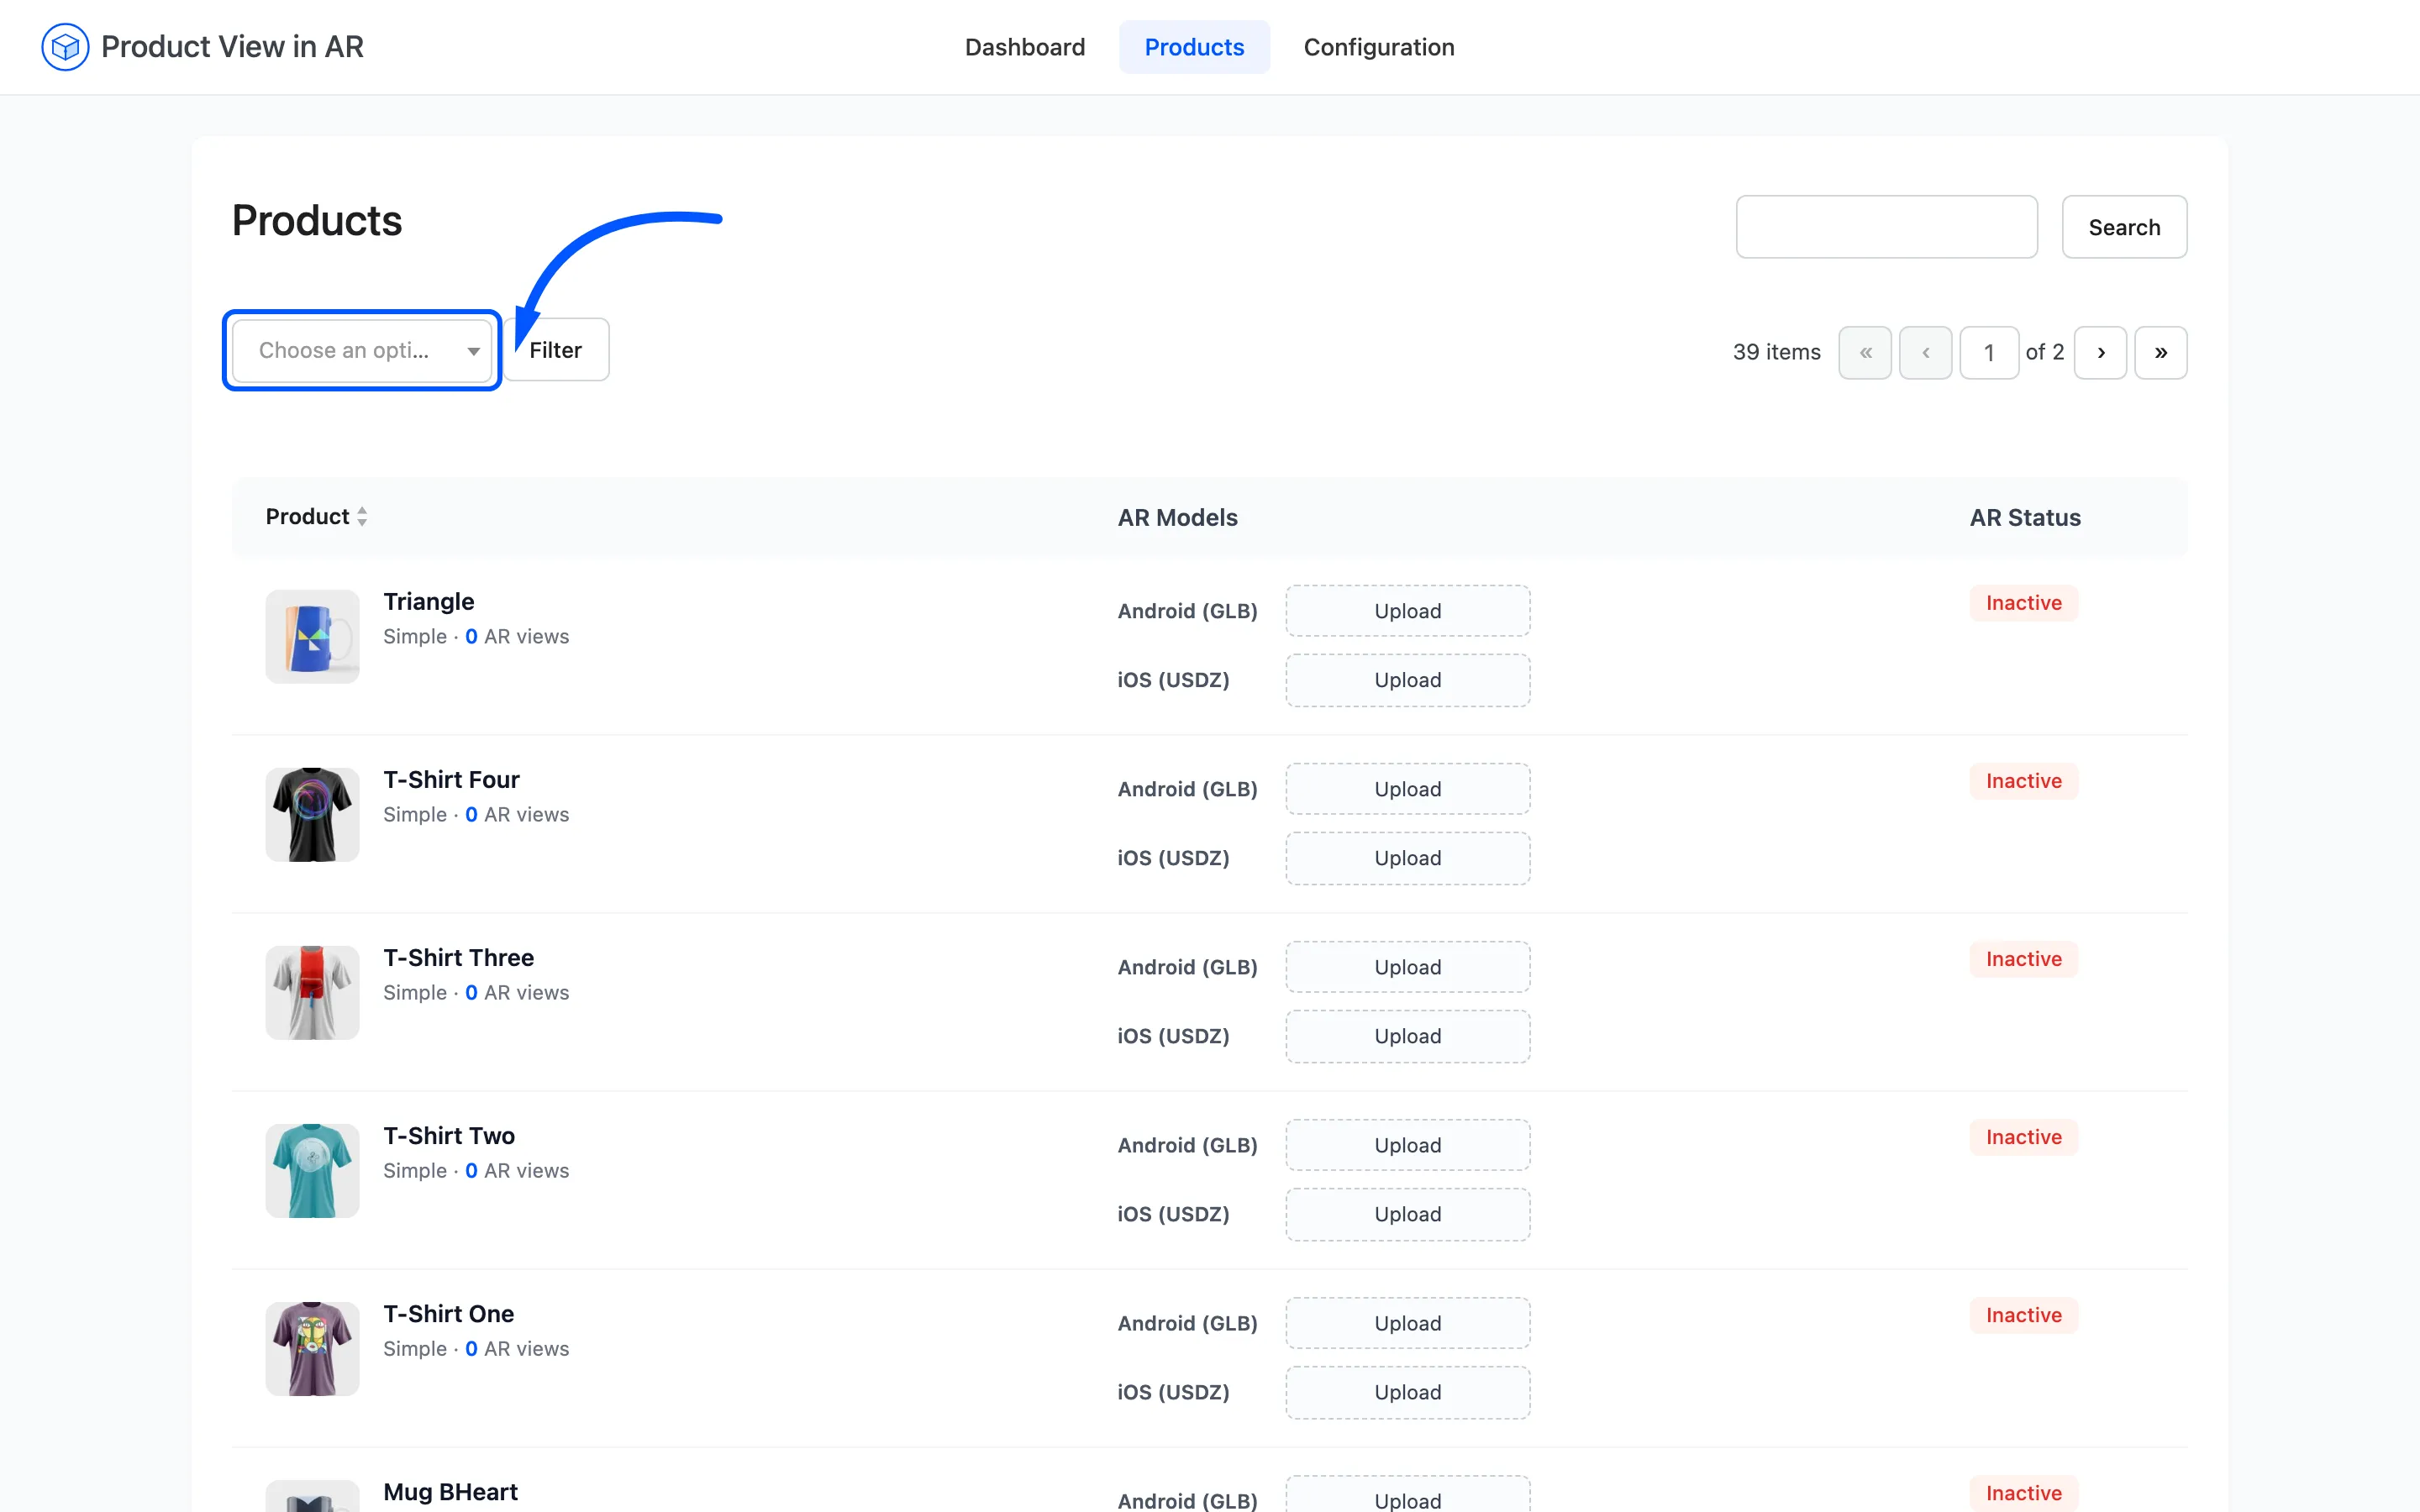
Press Filter.
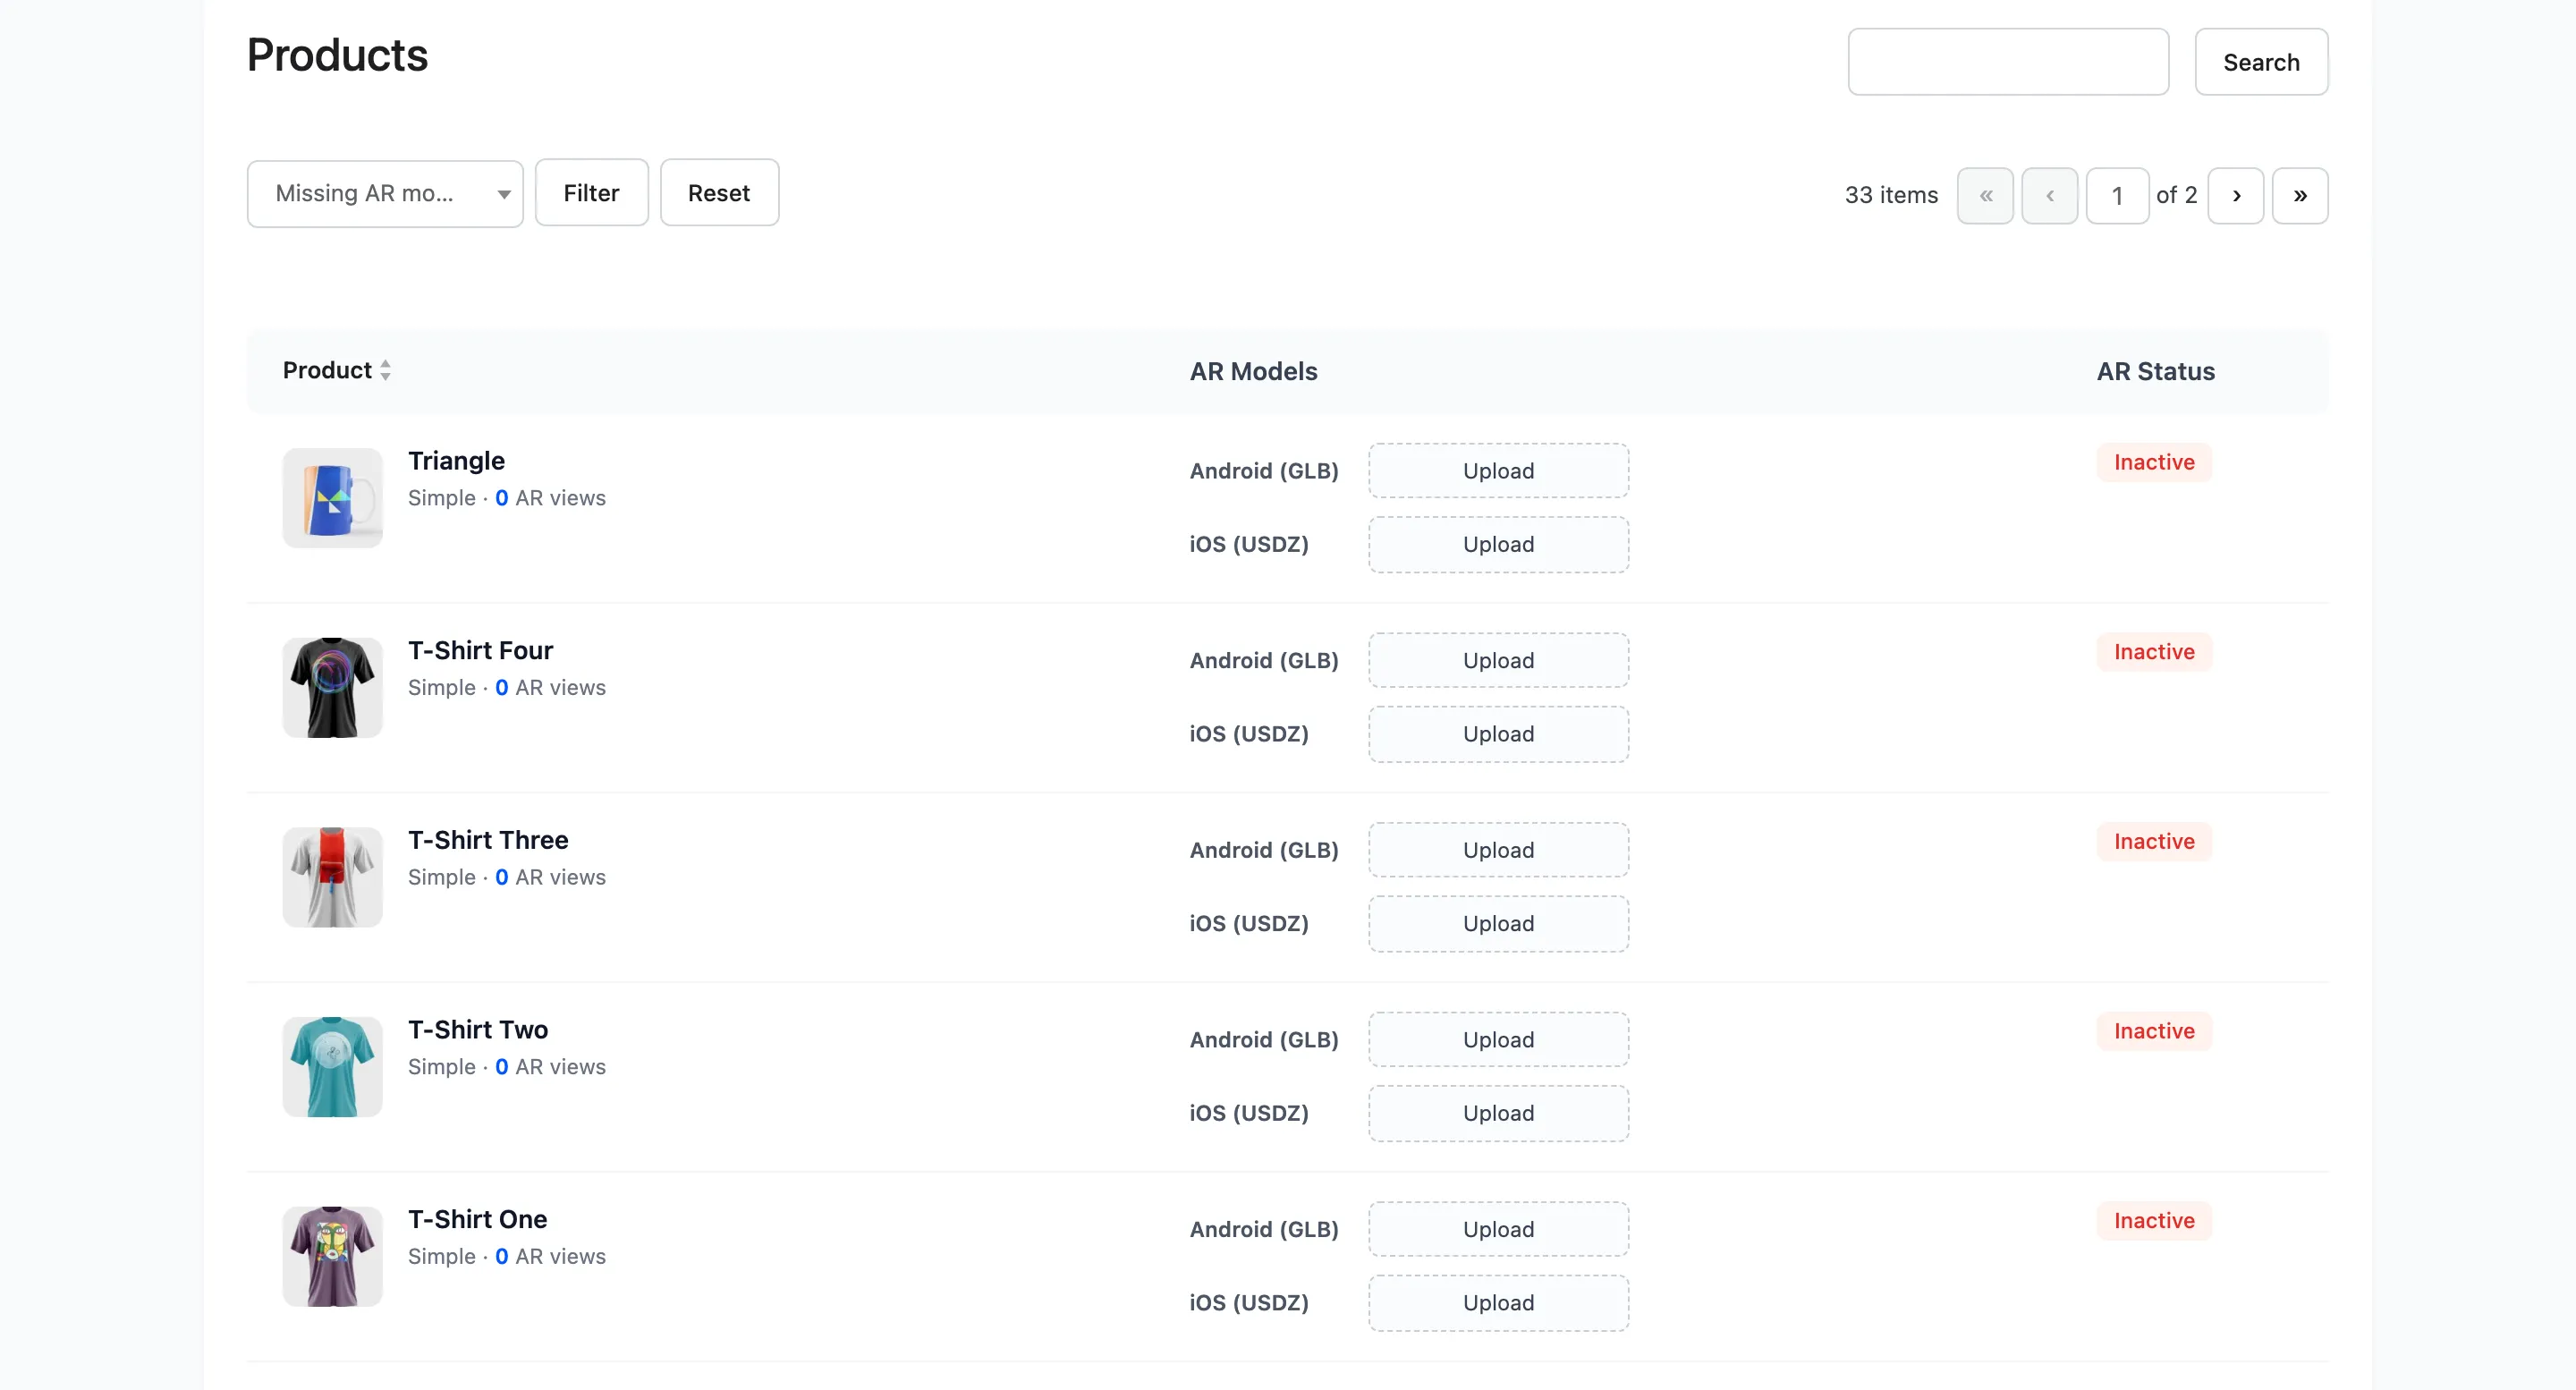
This is every product with no model, in one place, with its upload controls on the row. Raise the rows per page under Screen Options if you are working through it in one sitting. The search box narrows it further by product name.
Step 4: Find the half-done ones
Section titled “Step 4: Find the half-done ones”The trap in this job is the product that looks finished and is not. Its AR Status badge reads Active with only one of the two files attached.
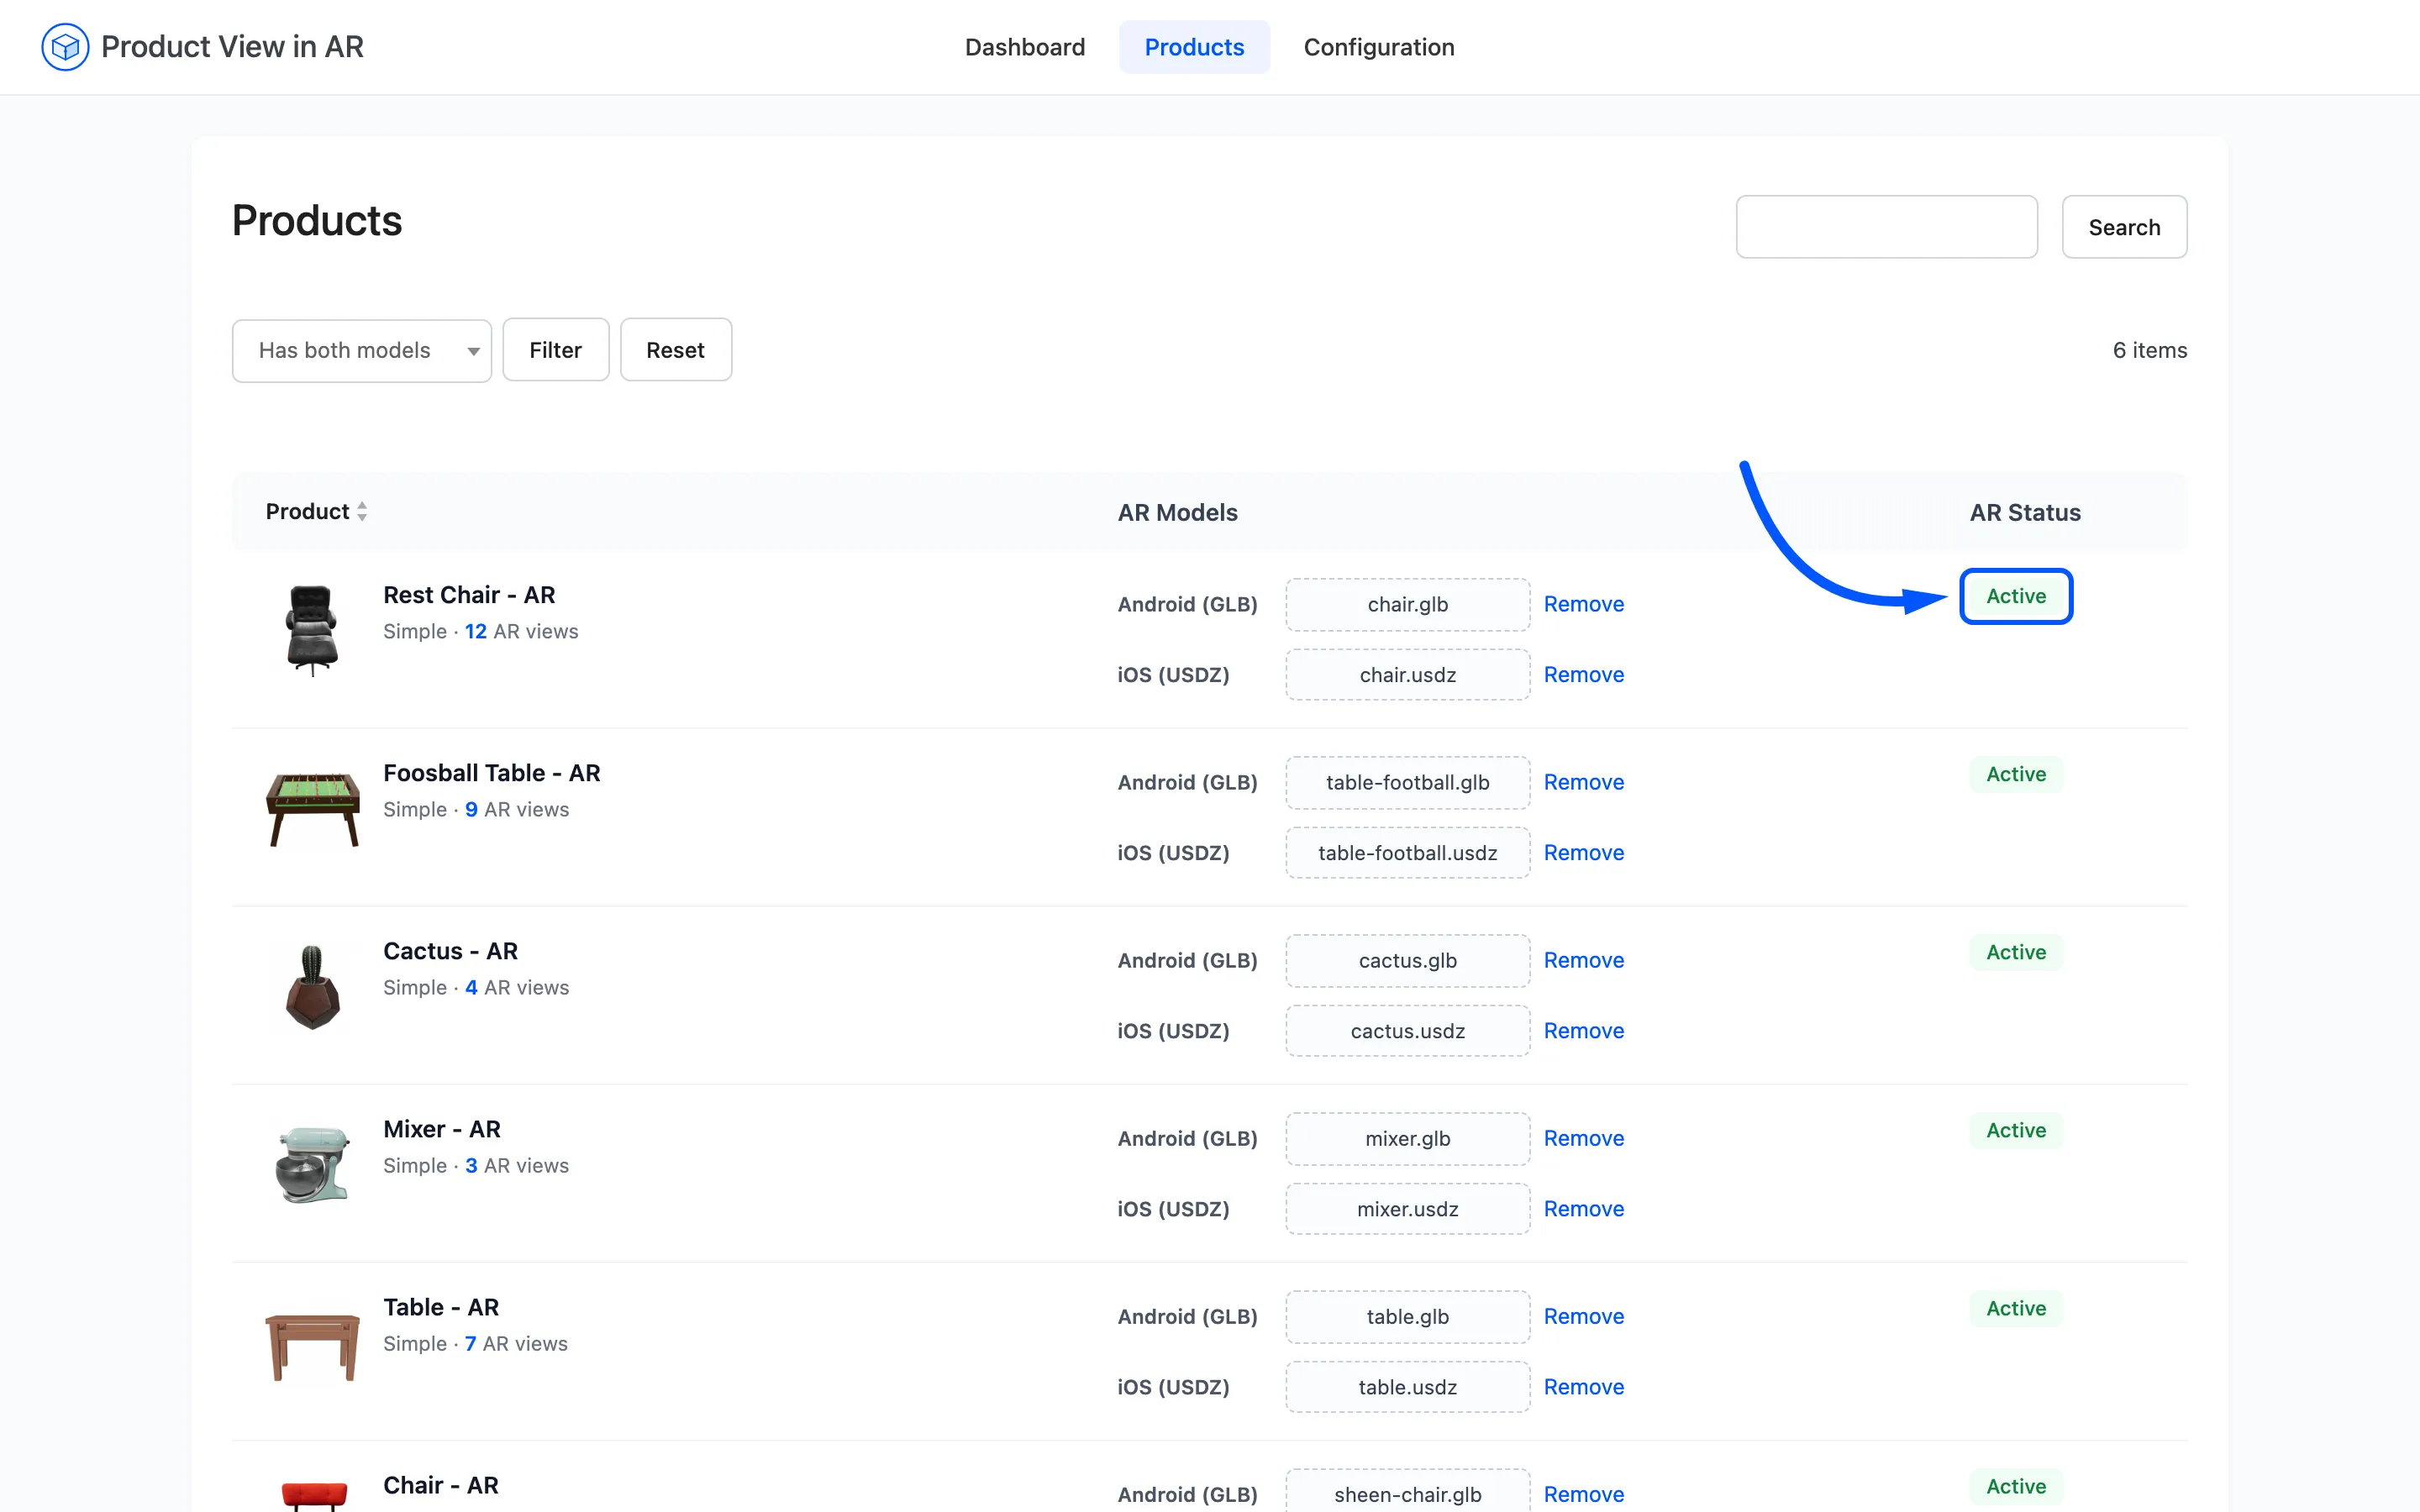
Two ways to catch them, and the second is faster.
- Filter by Has Android (GLB), then by Has iOS (USDZ). Whichever list is shorter is the format you have been forgetting.
- Compare the dashboard’s Android Models and iOS Models cards. They should be equal. Any difference between them is exactly the number of half-done products.
Step 5: Decide the order
Section titled “Step 5: Decide the order”You will not model everything, so let the numbers choose. Top Viewed Products on the dashboard ranks what shoppers already engage with.
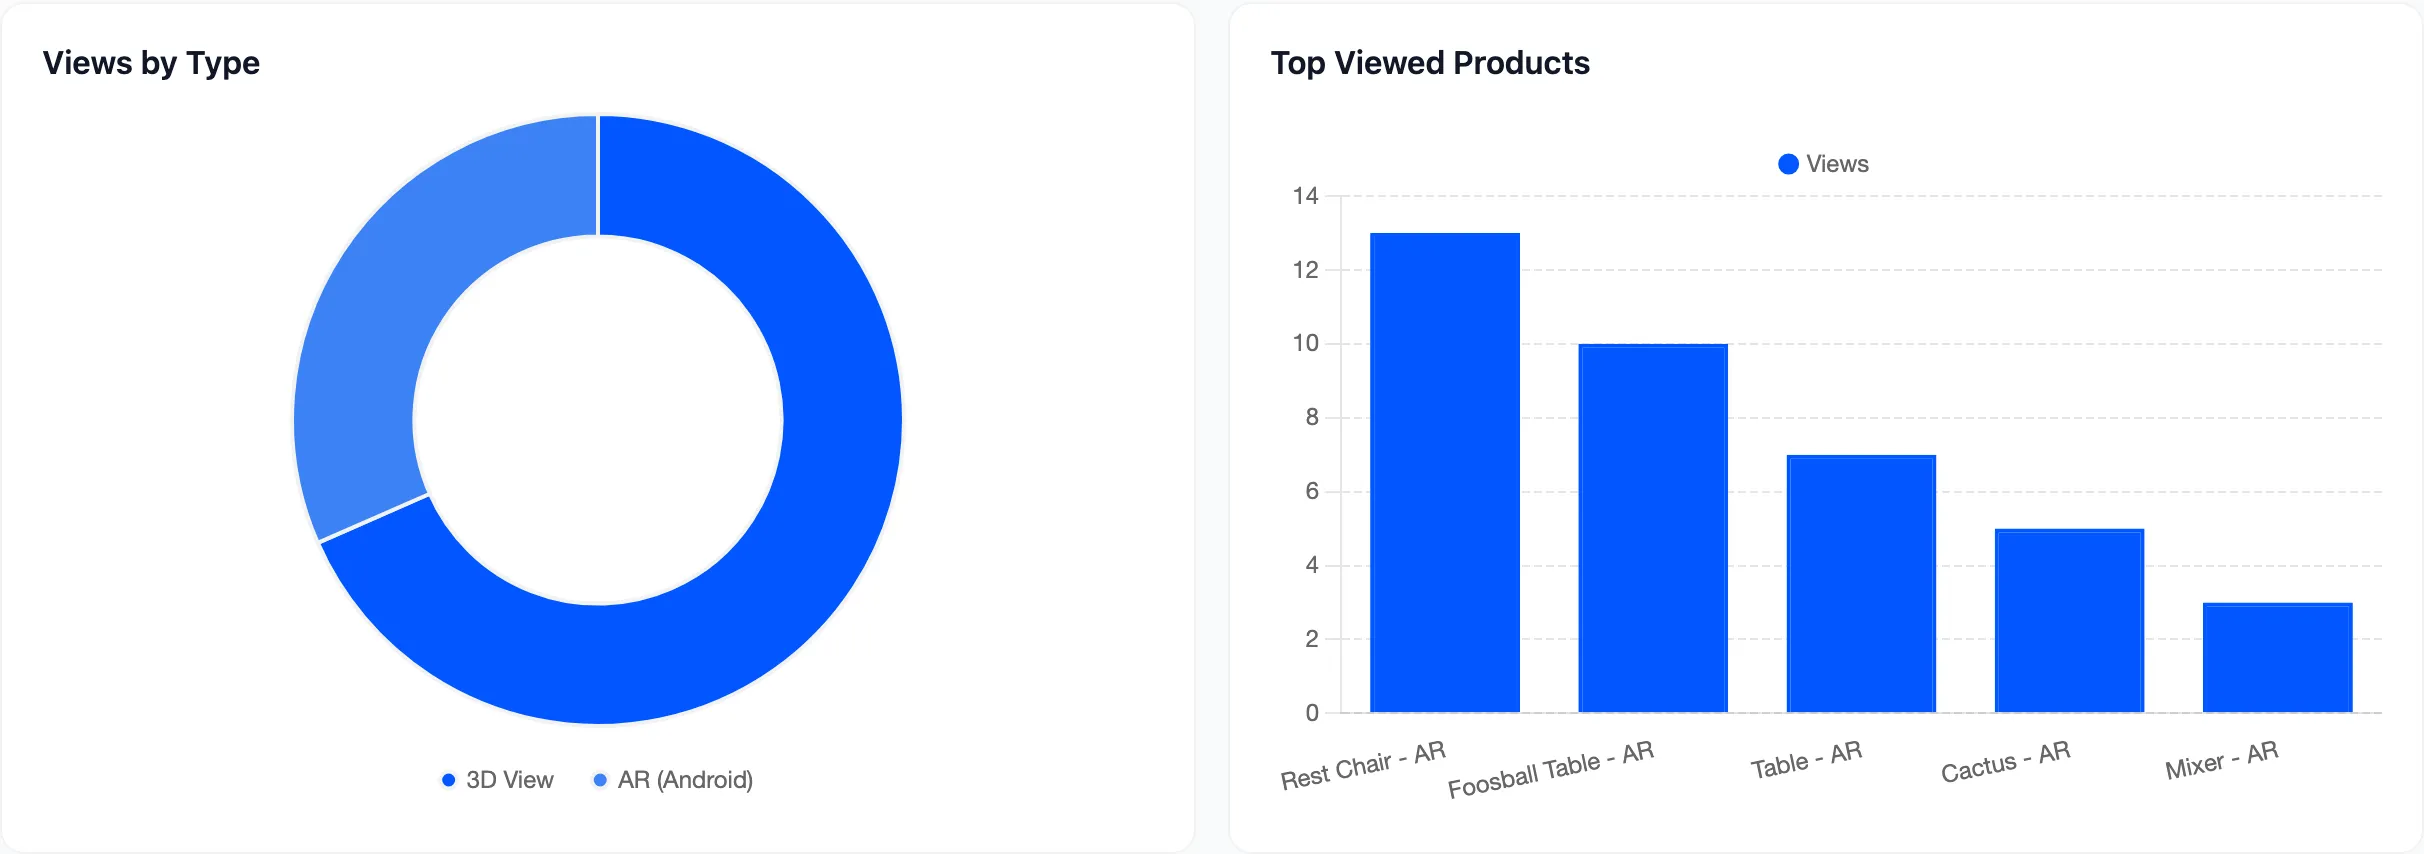
Products near the top of that chart are already earning their models back. Their catalogue neighbours are usually the best next candidates, because the same shoppers are looking at them.
For a store with no view data yet, order by revenue and by return rate. The products customers most often send back for being the wrong size are the ones AR pays for fastest.