

Dashboard Overview
The dashboard answers two different questions on one screen. How much of your catalogue has a model, and what shoppers are doing with the models you have.
Go to DevDiggers Plugins → Product View in AR → Dashboard.
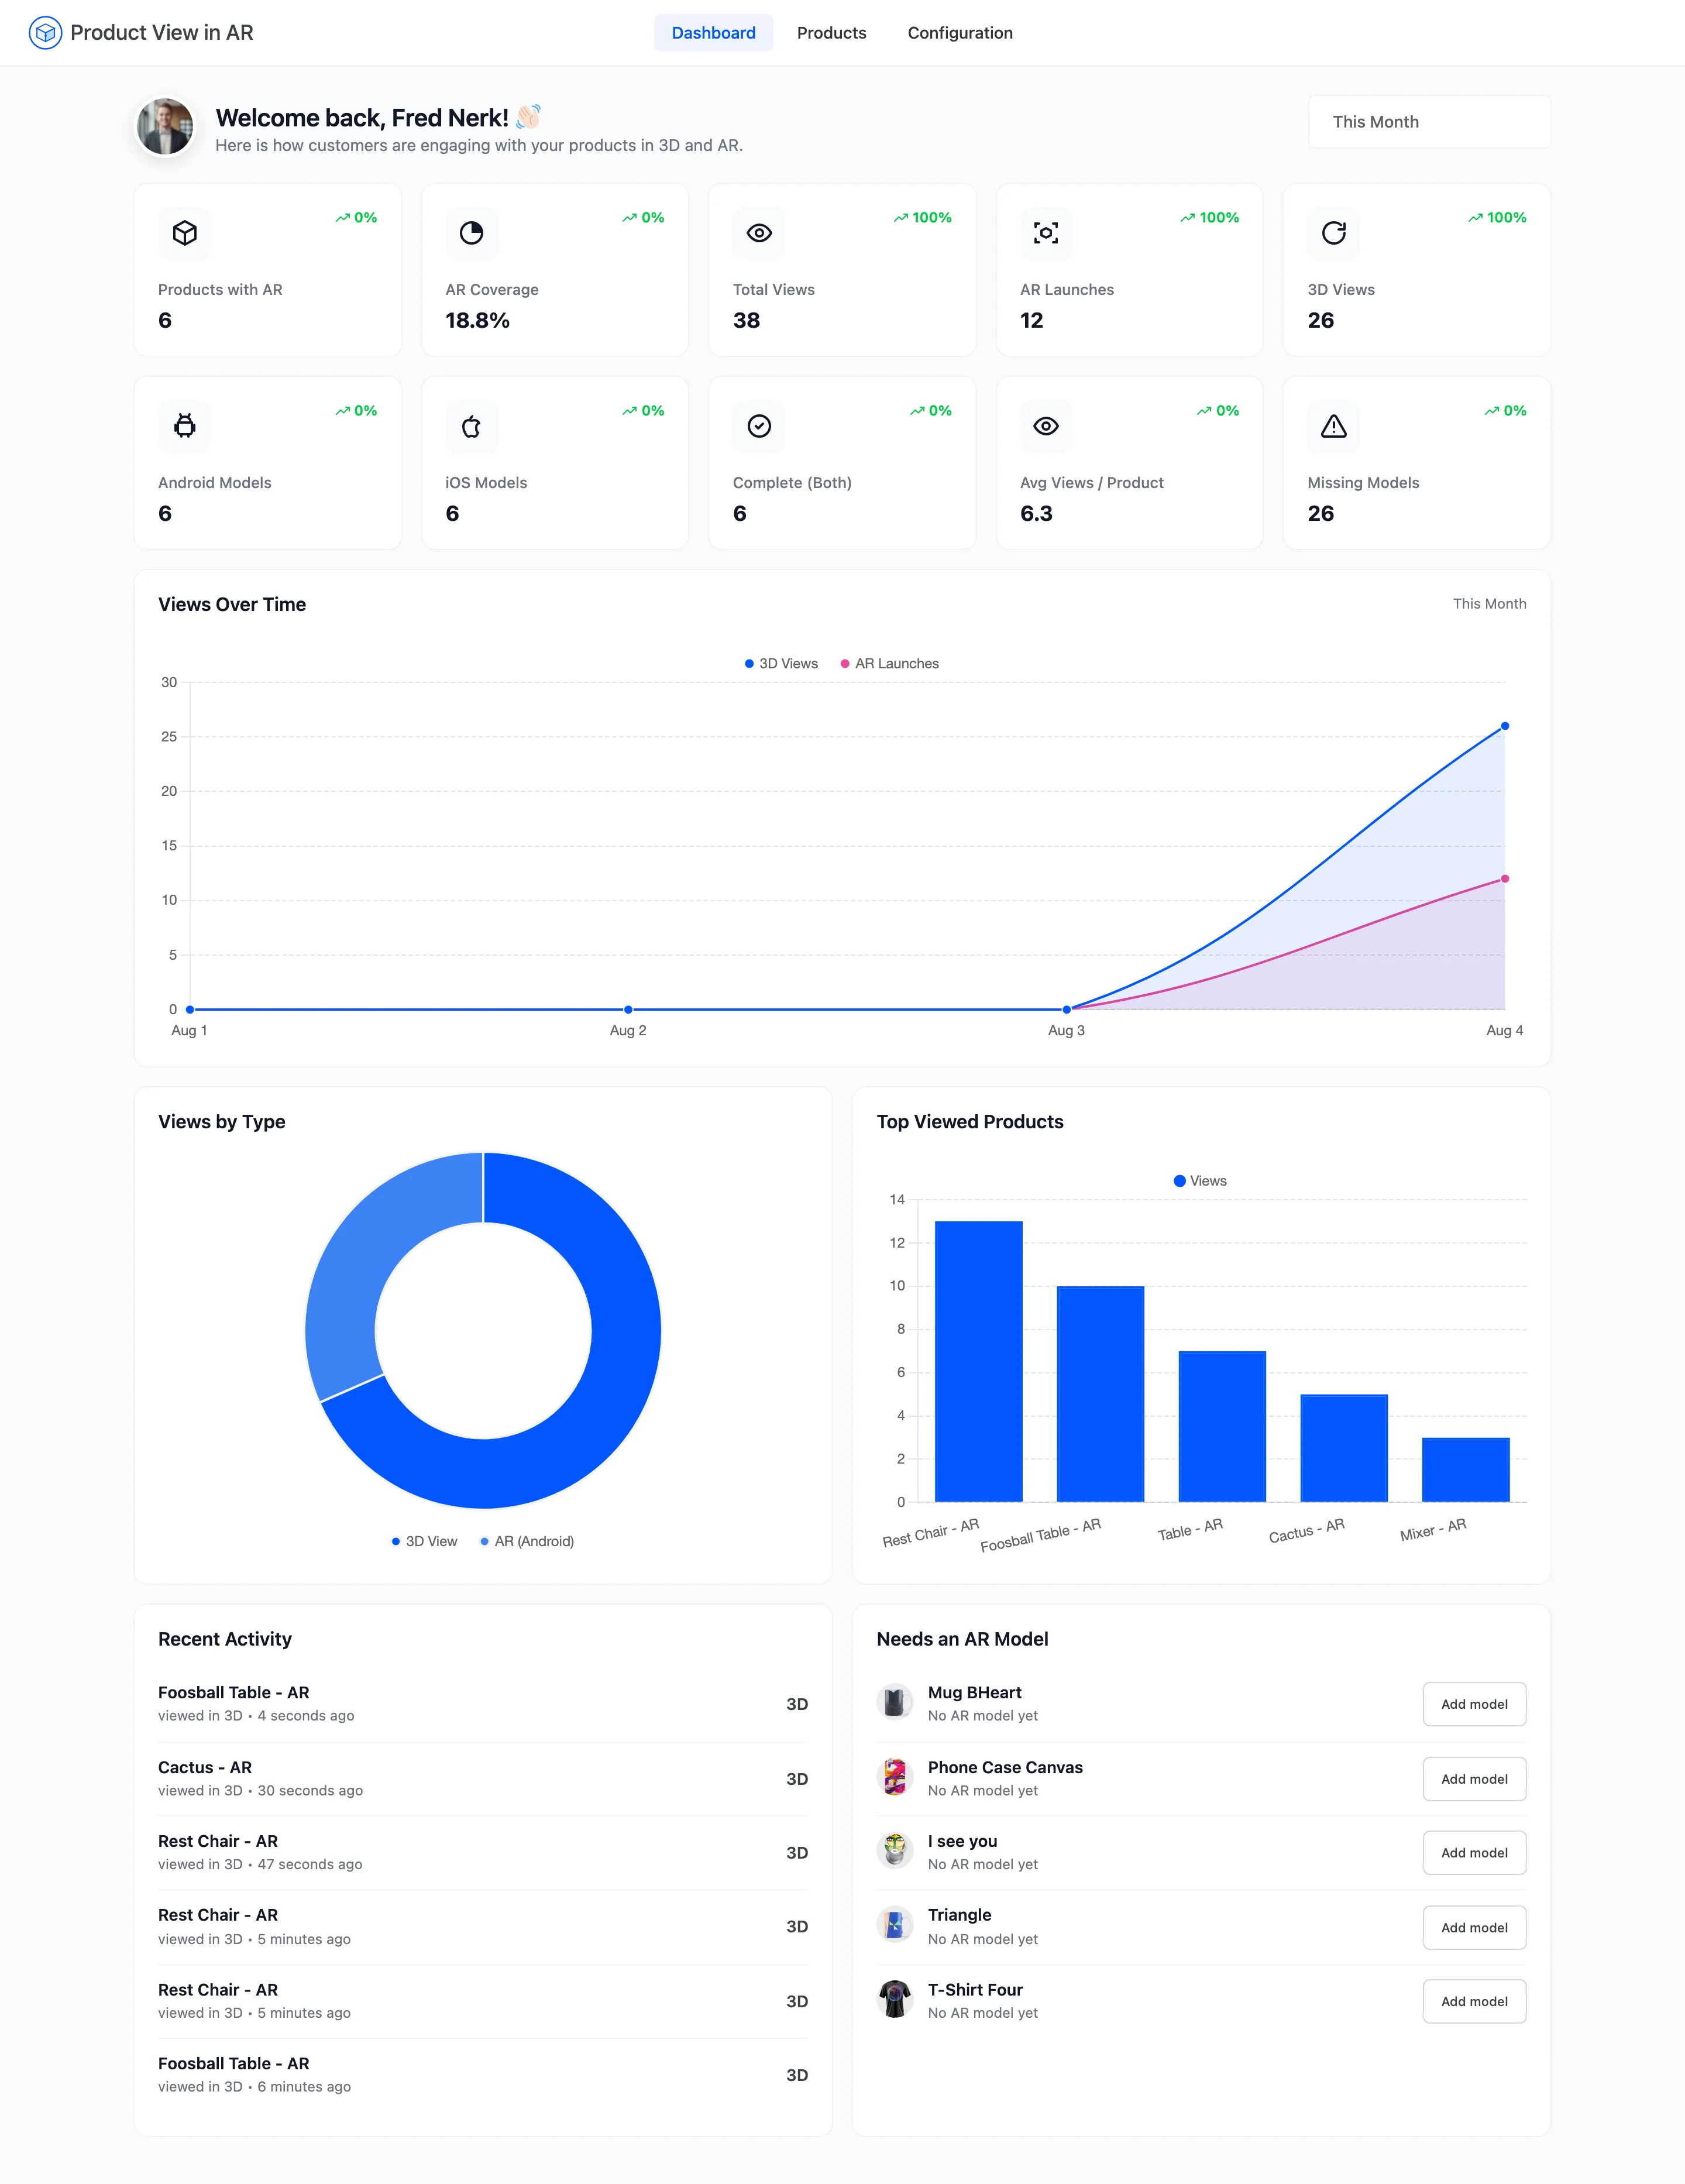
The date filter
Section titled “The date filter”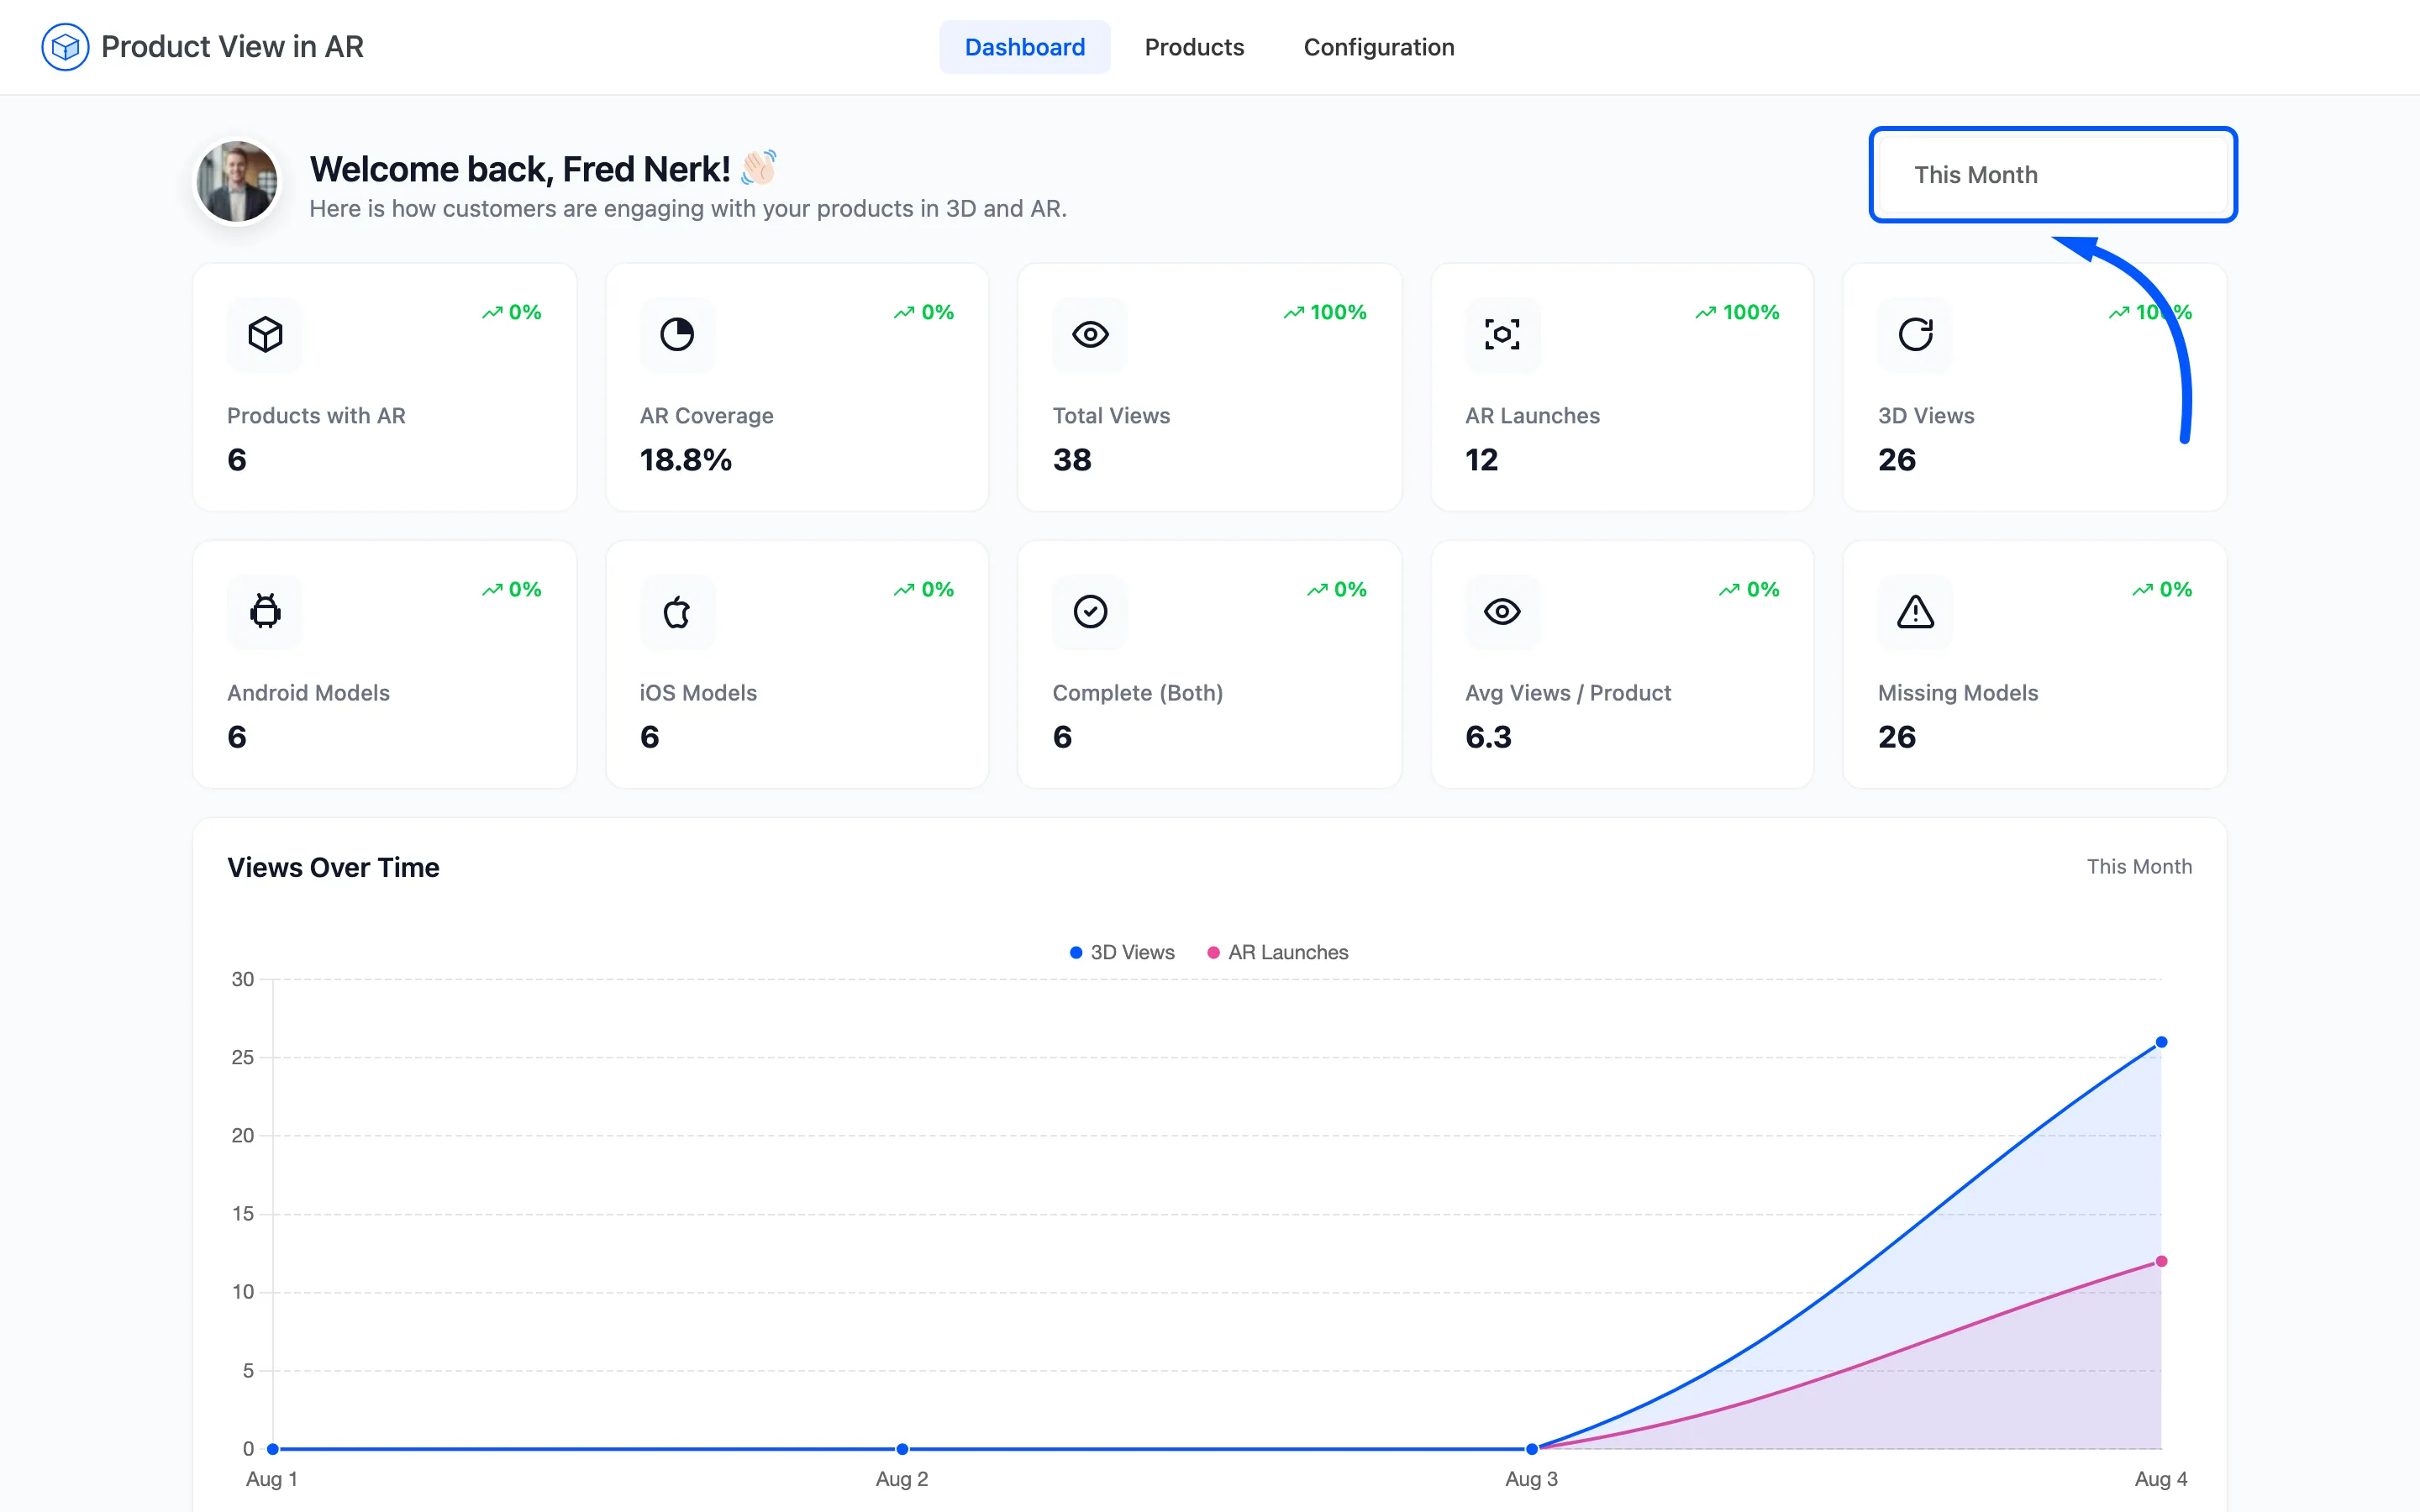
The picker at the top right sets the range for everything shopper-related: the view counts, the percentage changes and all three charts. It defaults to the last 30 days and offers presets plus a custom from and to date. All Time starts at your earliest recorded view.
Coverage numbers ignore it. A product either has a model or it does not, and that is not a time-series.
The summary cards
Section titled “The summary cards”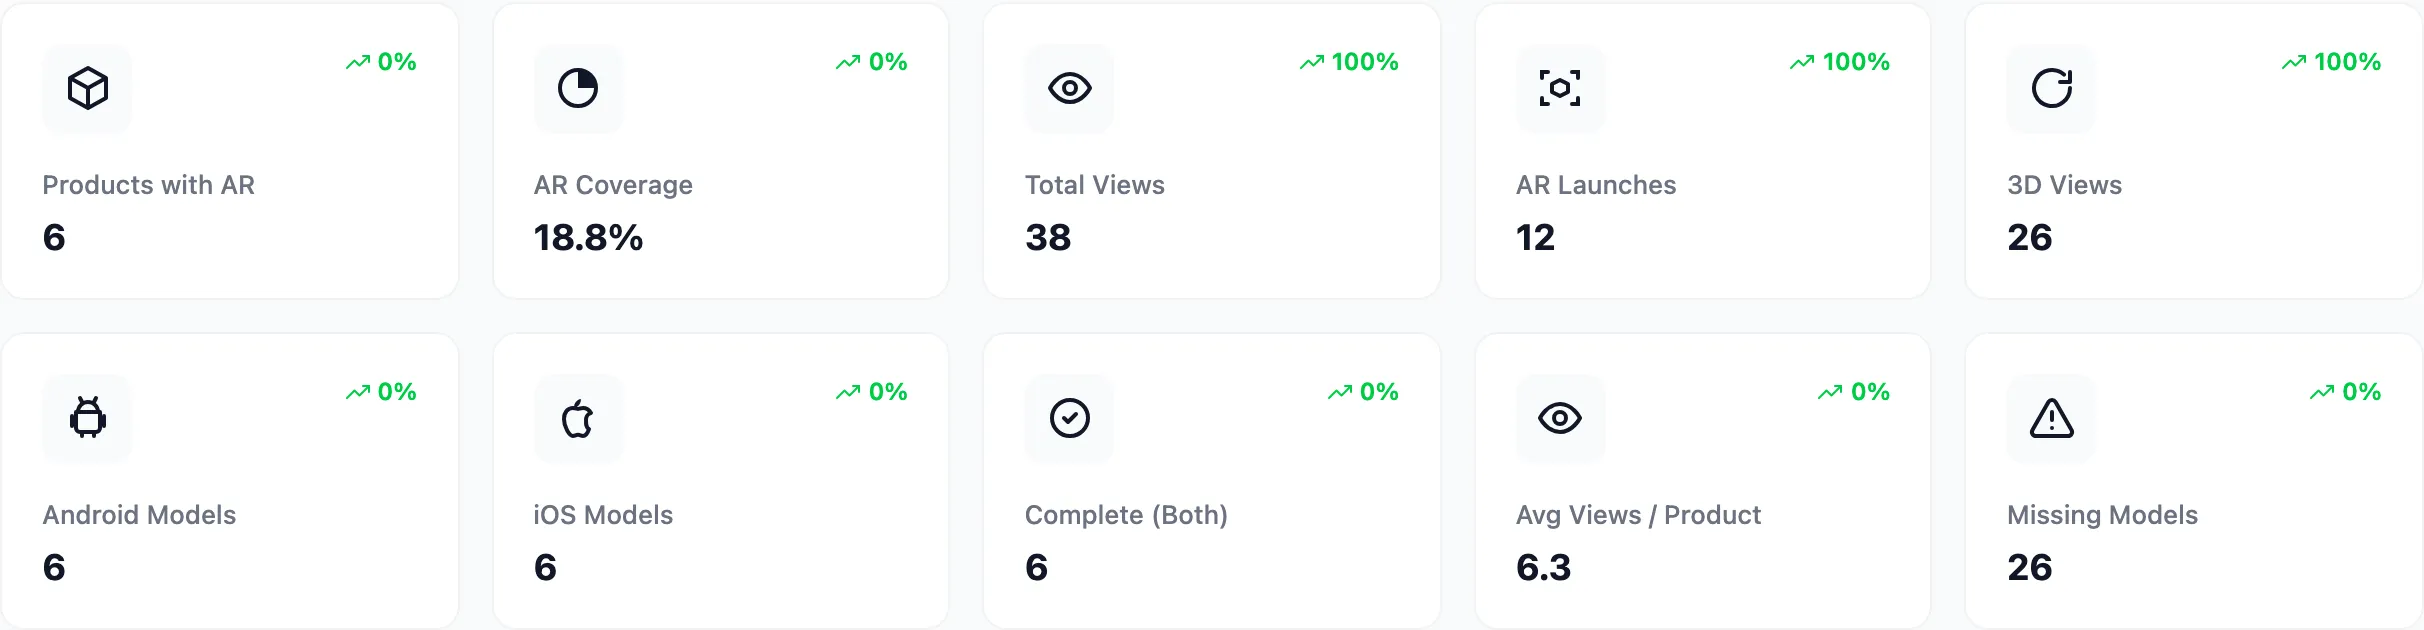
Ten cards, and it is worth knowing which four move with the date filter.
- Products with AR counts published products carrying at least one model file.
- AR Coverage is that count as a percentage of your published products. It is the single number worth watching while you roll models out.
- Total Views is every recorded view in the range, 3D and AR together.
- AR Launches counts only the times someone opened the phone’s AR viewer.
- 3D Views counts only the on-page 3D viewer.
- Android Models counts products with a
.glb. - iOS Models counts products with a
.usdz. - Complete (Both) counts products carrying both, which is the number you want to equal Products with AR.
- Avg Views / Product divides total views by products with a model.
- Missing Models is published products with neither file.
The green or red percentage on Total Views, AR Launches and 3D Views is a comparison. It measures the range against the period immediately before it, of the same length.
Views Over Time
Section titled “Views Over Time”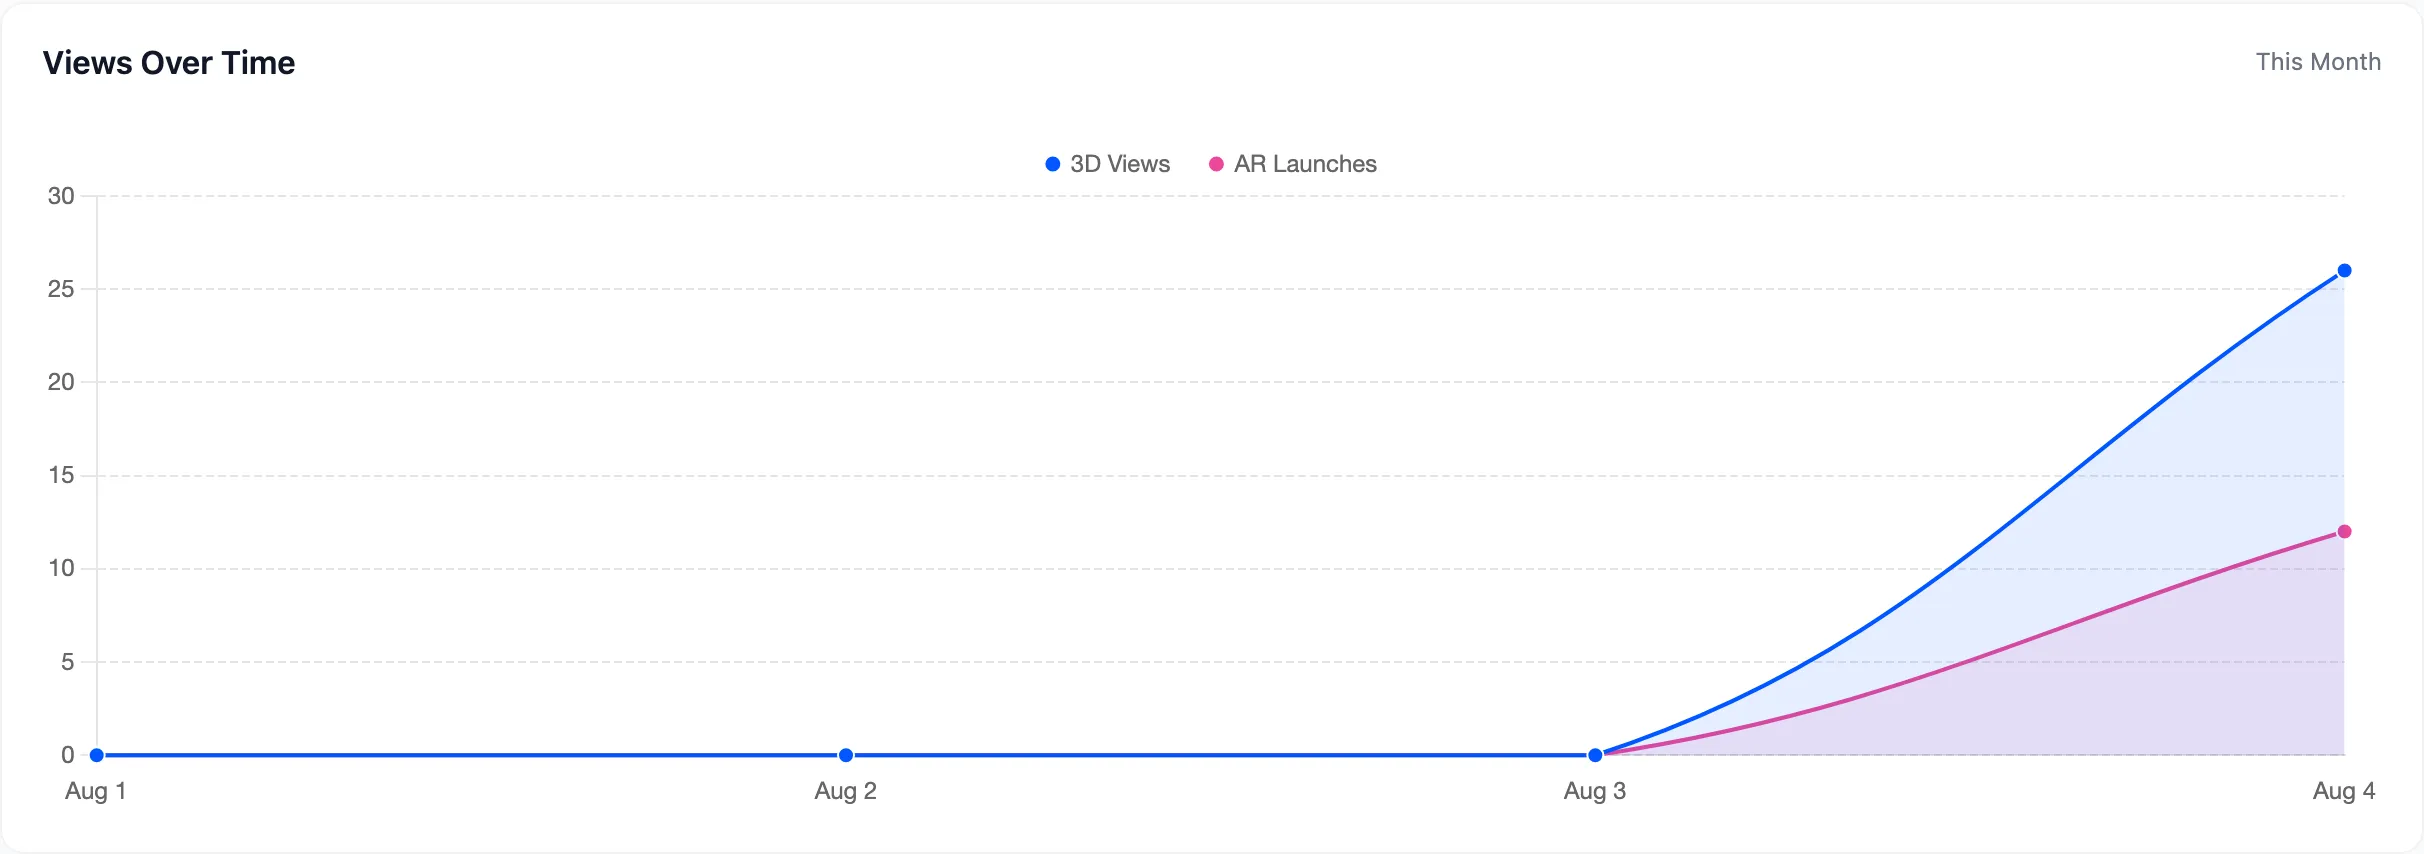
Two lines over the selected range: 3D Views in blue and AR Launches in pink. It tells you whether adding models changed anything. It also shows whether shoppers who spin a model go on to place it in their room.
Views by Type and Top Viewed Products
Section titled “Views by Type and Top Viewed Products”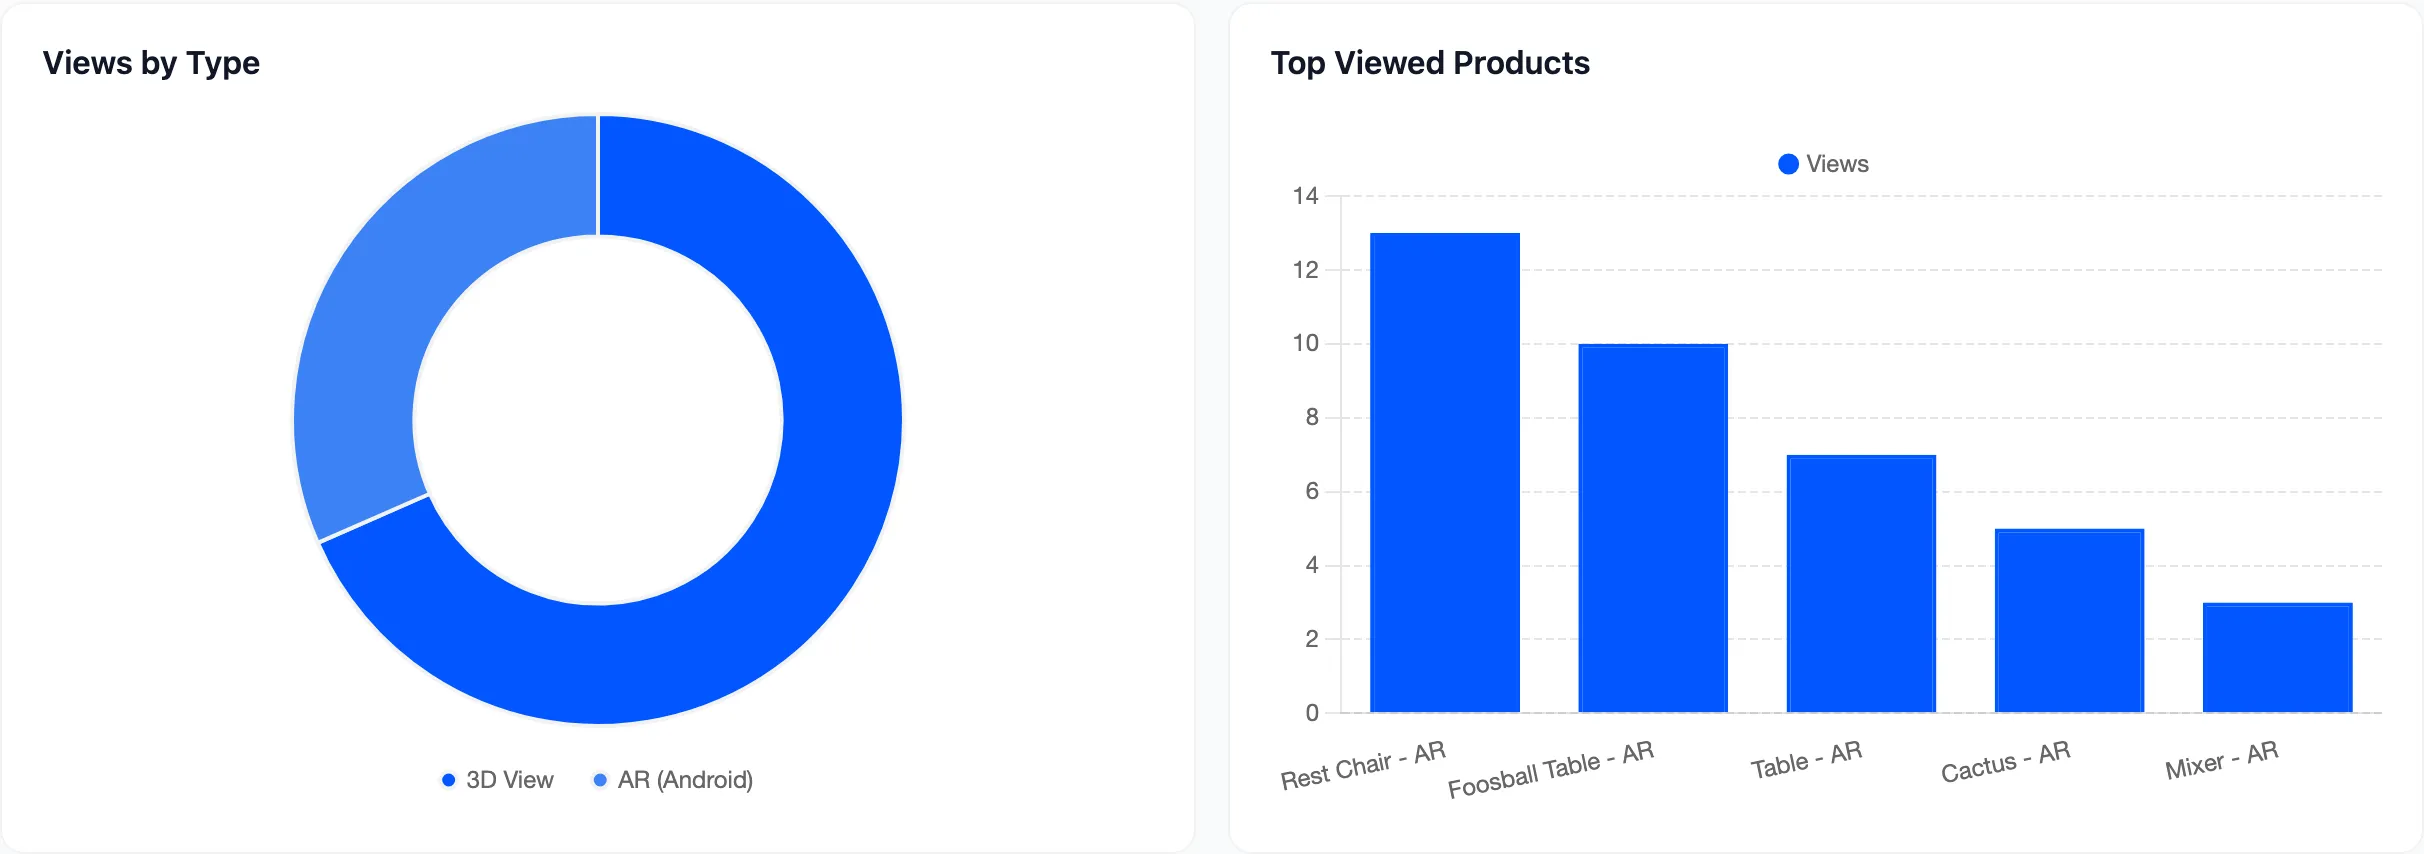
Views by Type splits the same total three ways: 3D View, AR (Android) and AR (iOS). A slice that is almost all 3D usually means models are being looked at on desktop. That is a signal to check the QR hand-off is on.
Top Viewed Products ranks your seven most-viewed products. Use it to decide which product gets the next model: the neighbours of a popular one usually earn theirs.
Recent Activity and Needs an AR Model
Section titled “Recent Activity and Needs an AR Model”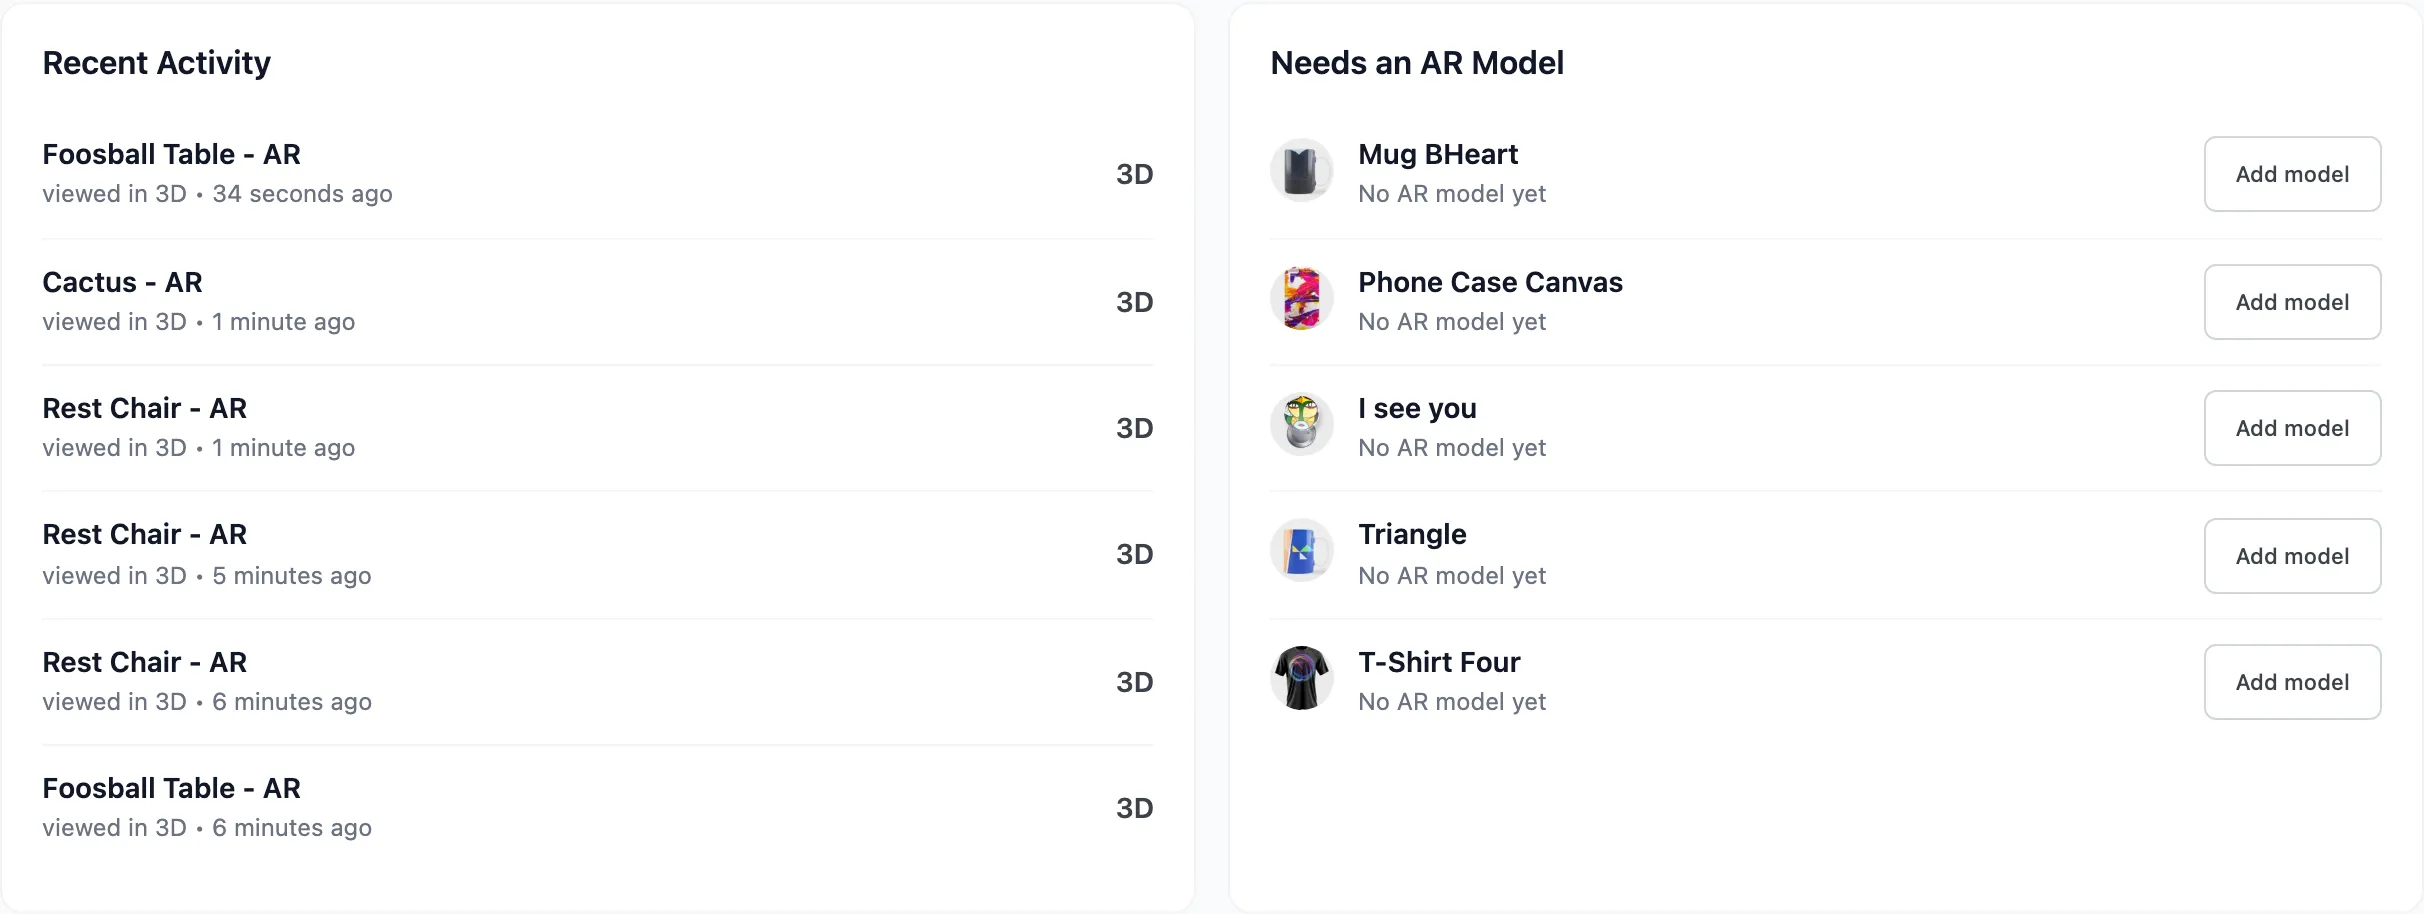
Recent Activity is the last six views, written as a plain sentence each. Each one names the product, whether it was viewed in 3D or opened in AR, and how long ago. It is the fastest way to confirm tracking is working after you turn it on.
Needs an AR Model lists five published products with no model, each with an Add model button.
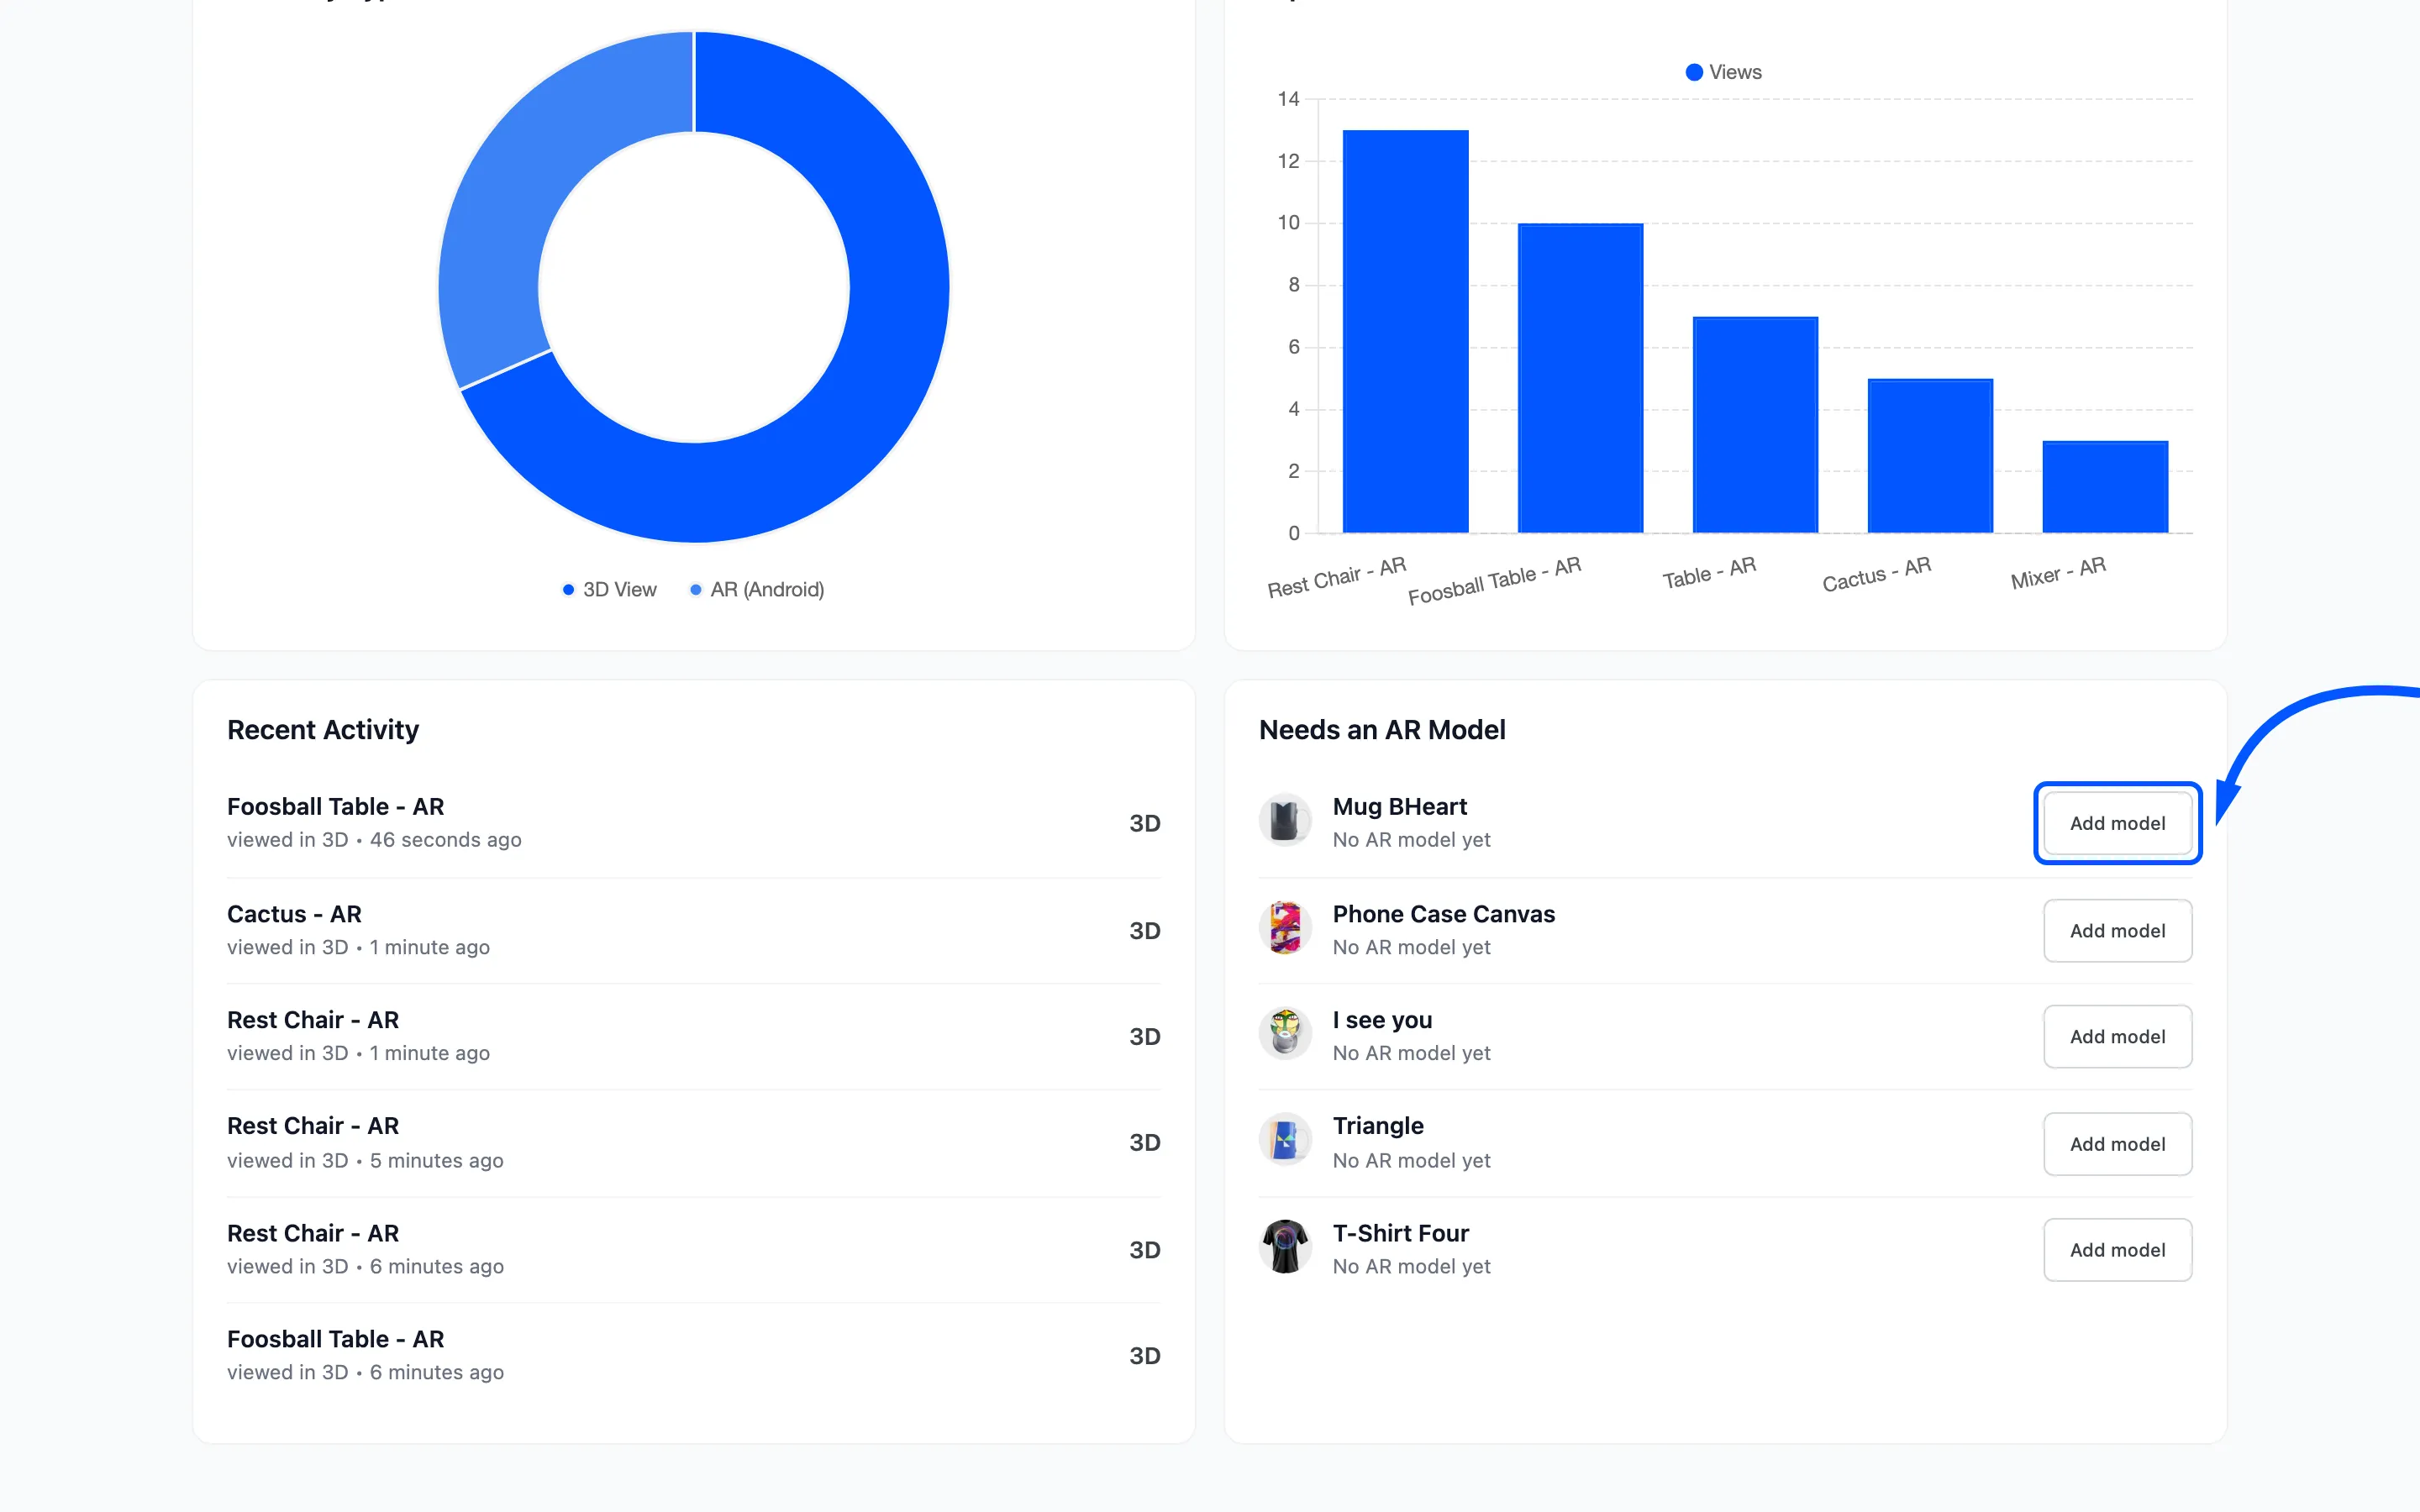
That button is a shortcut worth knowing. It opens the Products screen filtered to that one product, so you are one click from the upload control rather than searching a list.