

How to Read Your Image Search Analytics
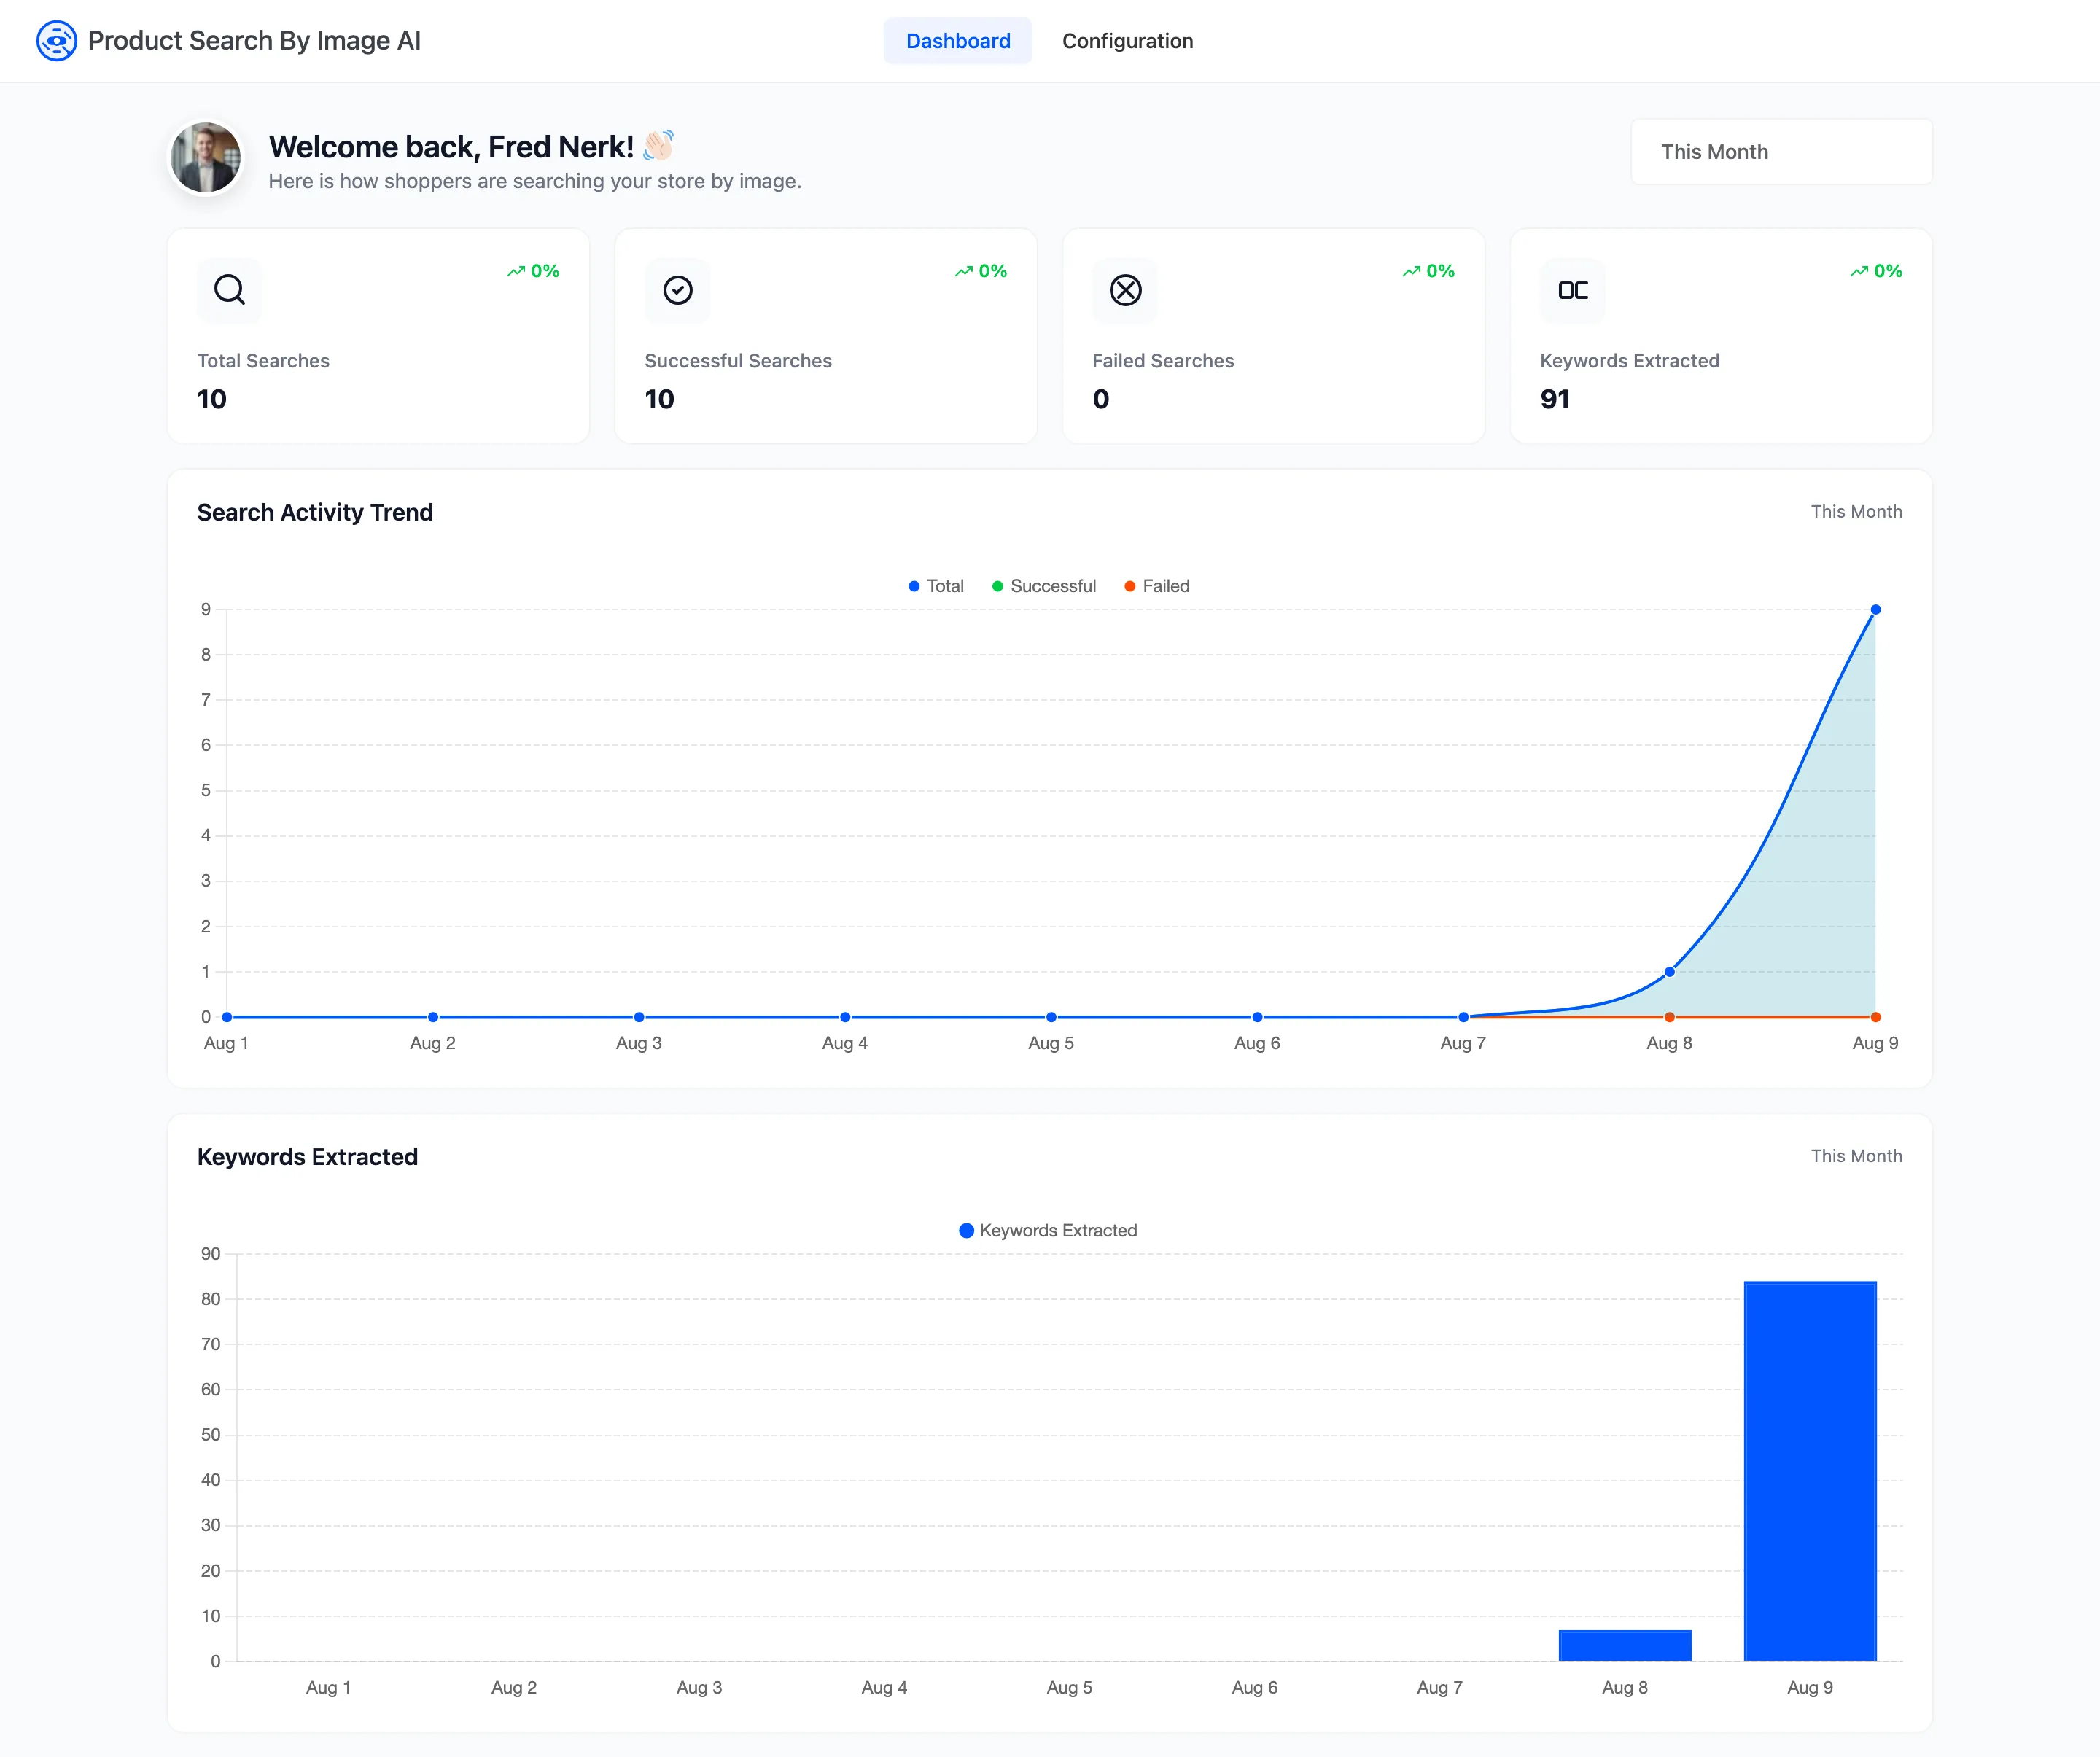
The dashboard has four numbers and two charts, and each one answers a different question. Read in this order they tell you what to change.
Go to DevDiggers Plugins → Product Search By Image AI → Dashboard.
Step 1: Check the failure rate first
Section titled “Step 1: Check the failure rate first”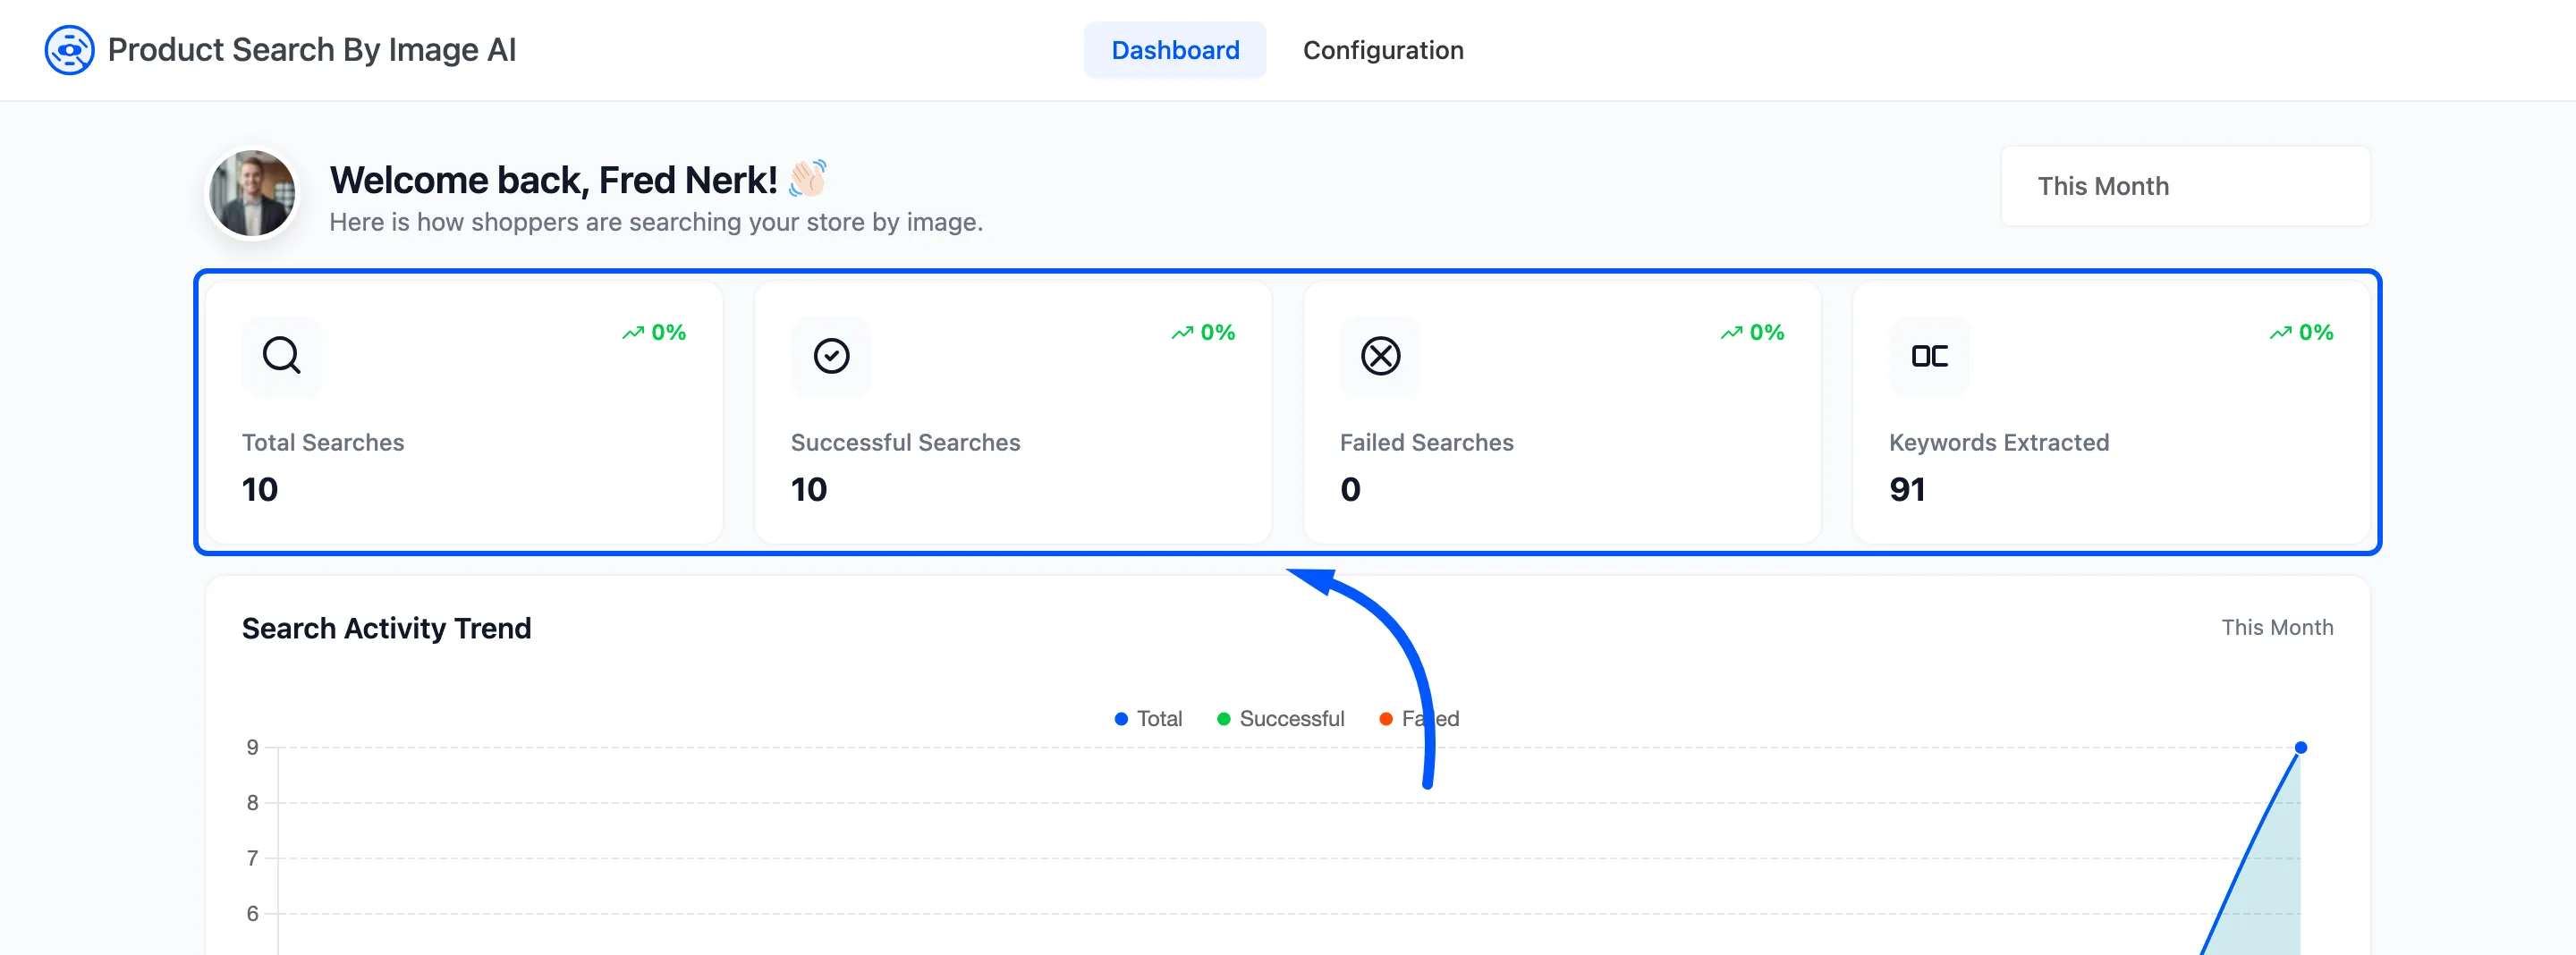
Compare Failed Searches against Total Searches. This is the health check, and it comes first because a broken AI service makes every other number meaningless.
- Failed at or near zero: The service is answering. Move on.
- Failed climbing steadily: Your provider is refusing work. On Hugging Face or Google Vision that is a wrong key, a revoked key, or a monthly quota that has run out.
- Failed roughly matching Total: Nothing is working at all. Check the key on the General tab, or switch back to TensorFlow.js, which needs no key.
Remember these four are lifetime totals, so a burst of failures last month is still in them. The chart below is where you see when it happened.
Step 2: Read the trend chart
Section titled “Step 2: Read the trend chart”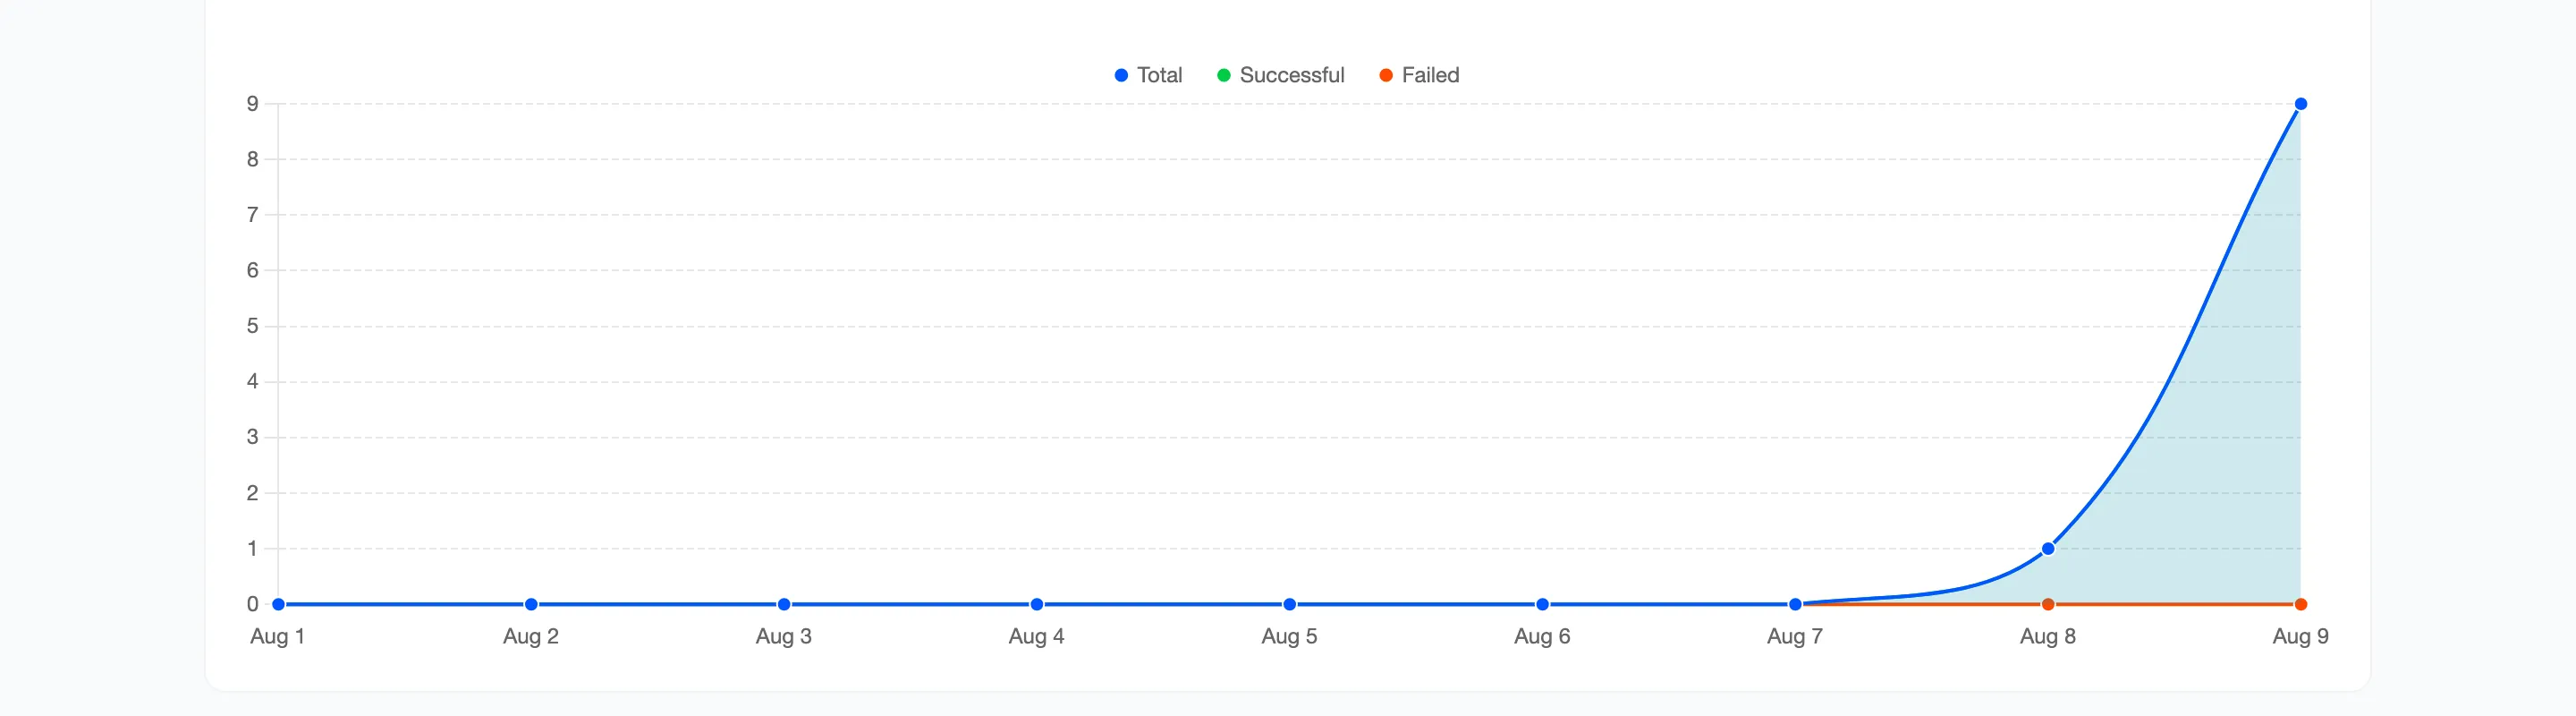
Three lines: Total, Successful and Failed, over the selected range.
- Total and Successful sitting on top of each other is the healthy shape.
- A gap opening between them dates the problem. Line it up against the day you changed provider or key.
- A Total line that is flat at zero means shoppers are not using the feature. That is a storefront problem, not a settings one: check the icon is actually visible in the search box people use.
Step 3: Check the words per search
Section titled “Step 3: Check the words per search”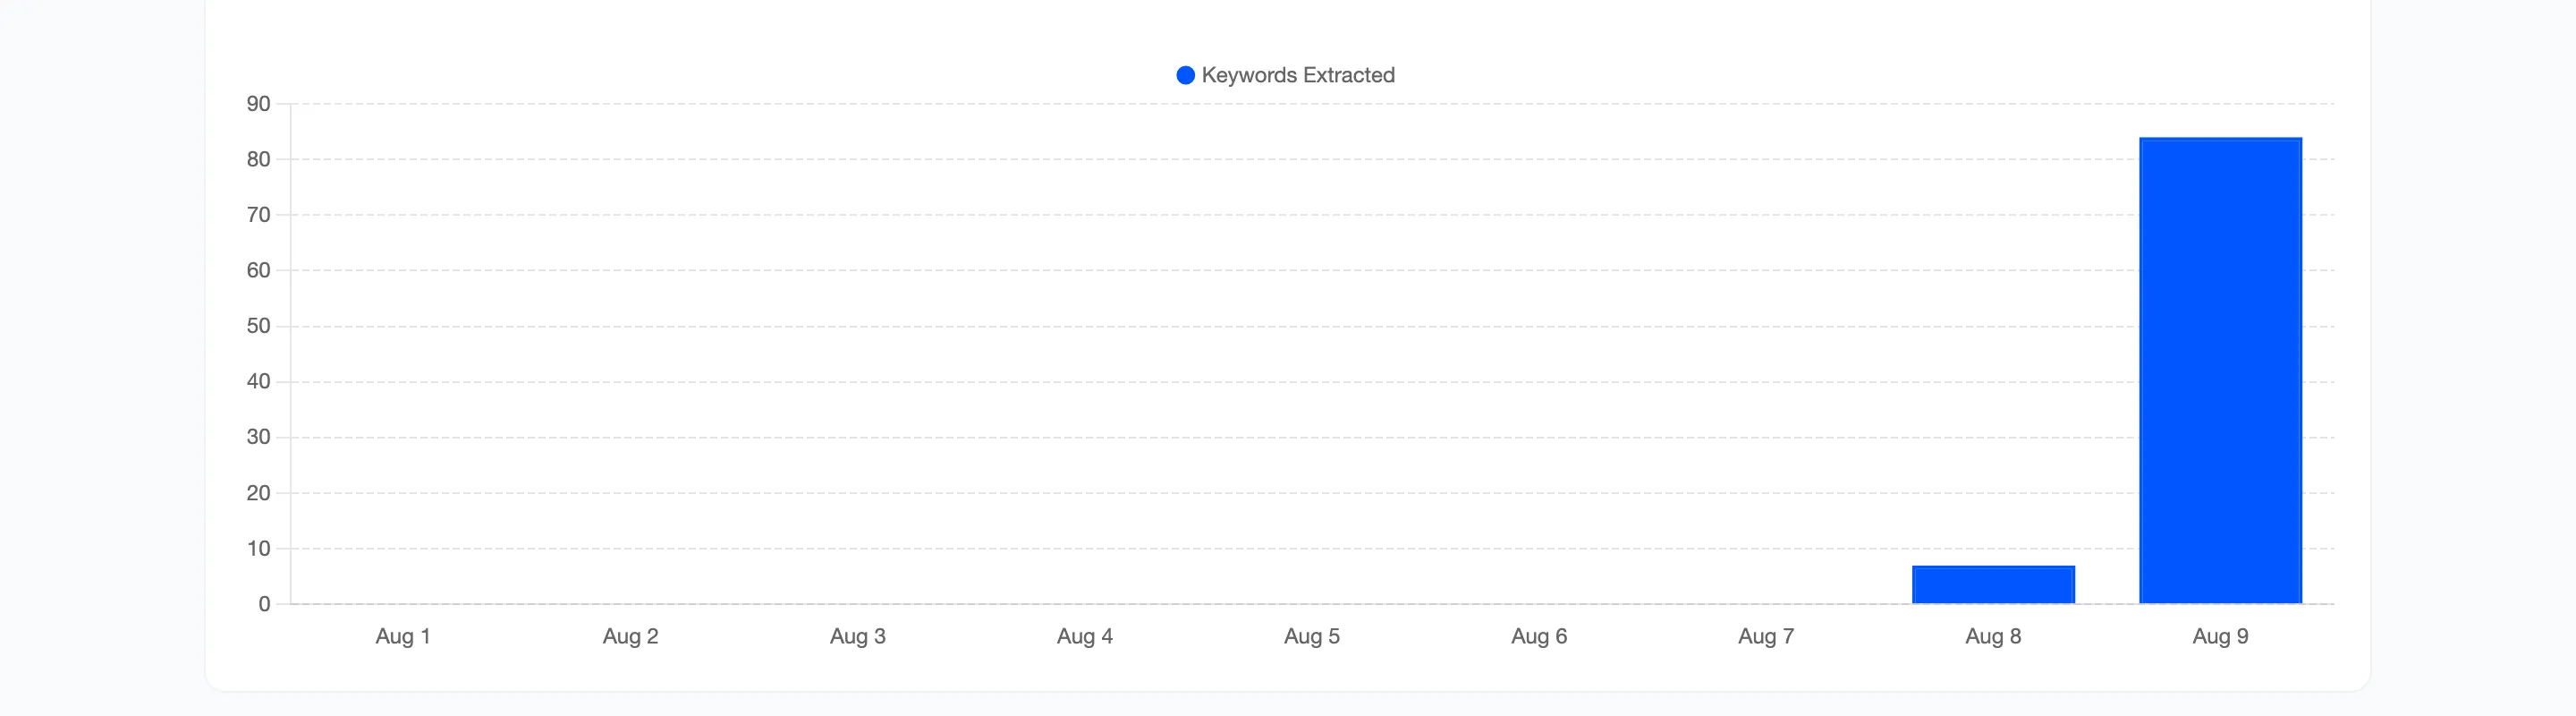
Divide Keywords Extracted by Total Searches. With the shipped Maximum Number of Keywords of 10, a healthy store lands near ten.
- Close to your maximum: The service is confident and the search is as wide as you allowed.
- Well under it: Photos are coming back with a word or two. Either the photos are hard to read, or the service is returning only what it is sure about. Hugging Face does this more than the other two, because it drops its low-confidence labels.
If the number is high and results are loose, lower Maximum Number of Keywords. See How to Control What the Search Matches.
Step 4: Compare a period against another
Section titled “Step 4: Compare a period against another”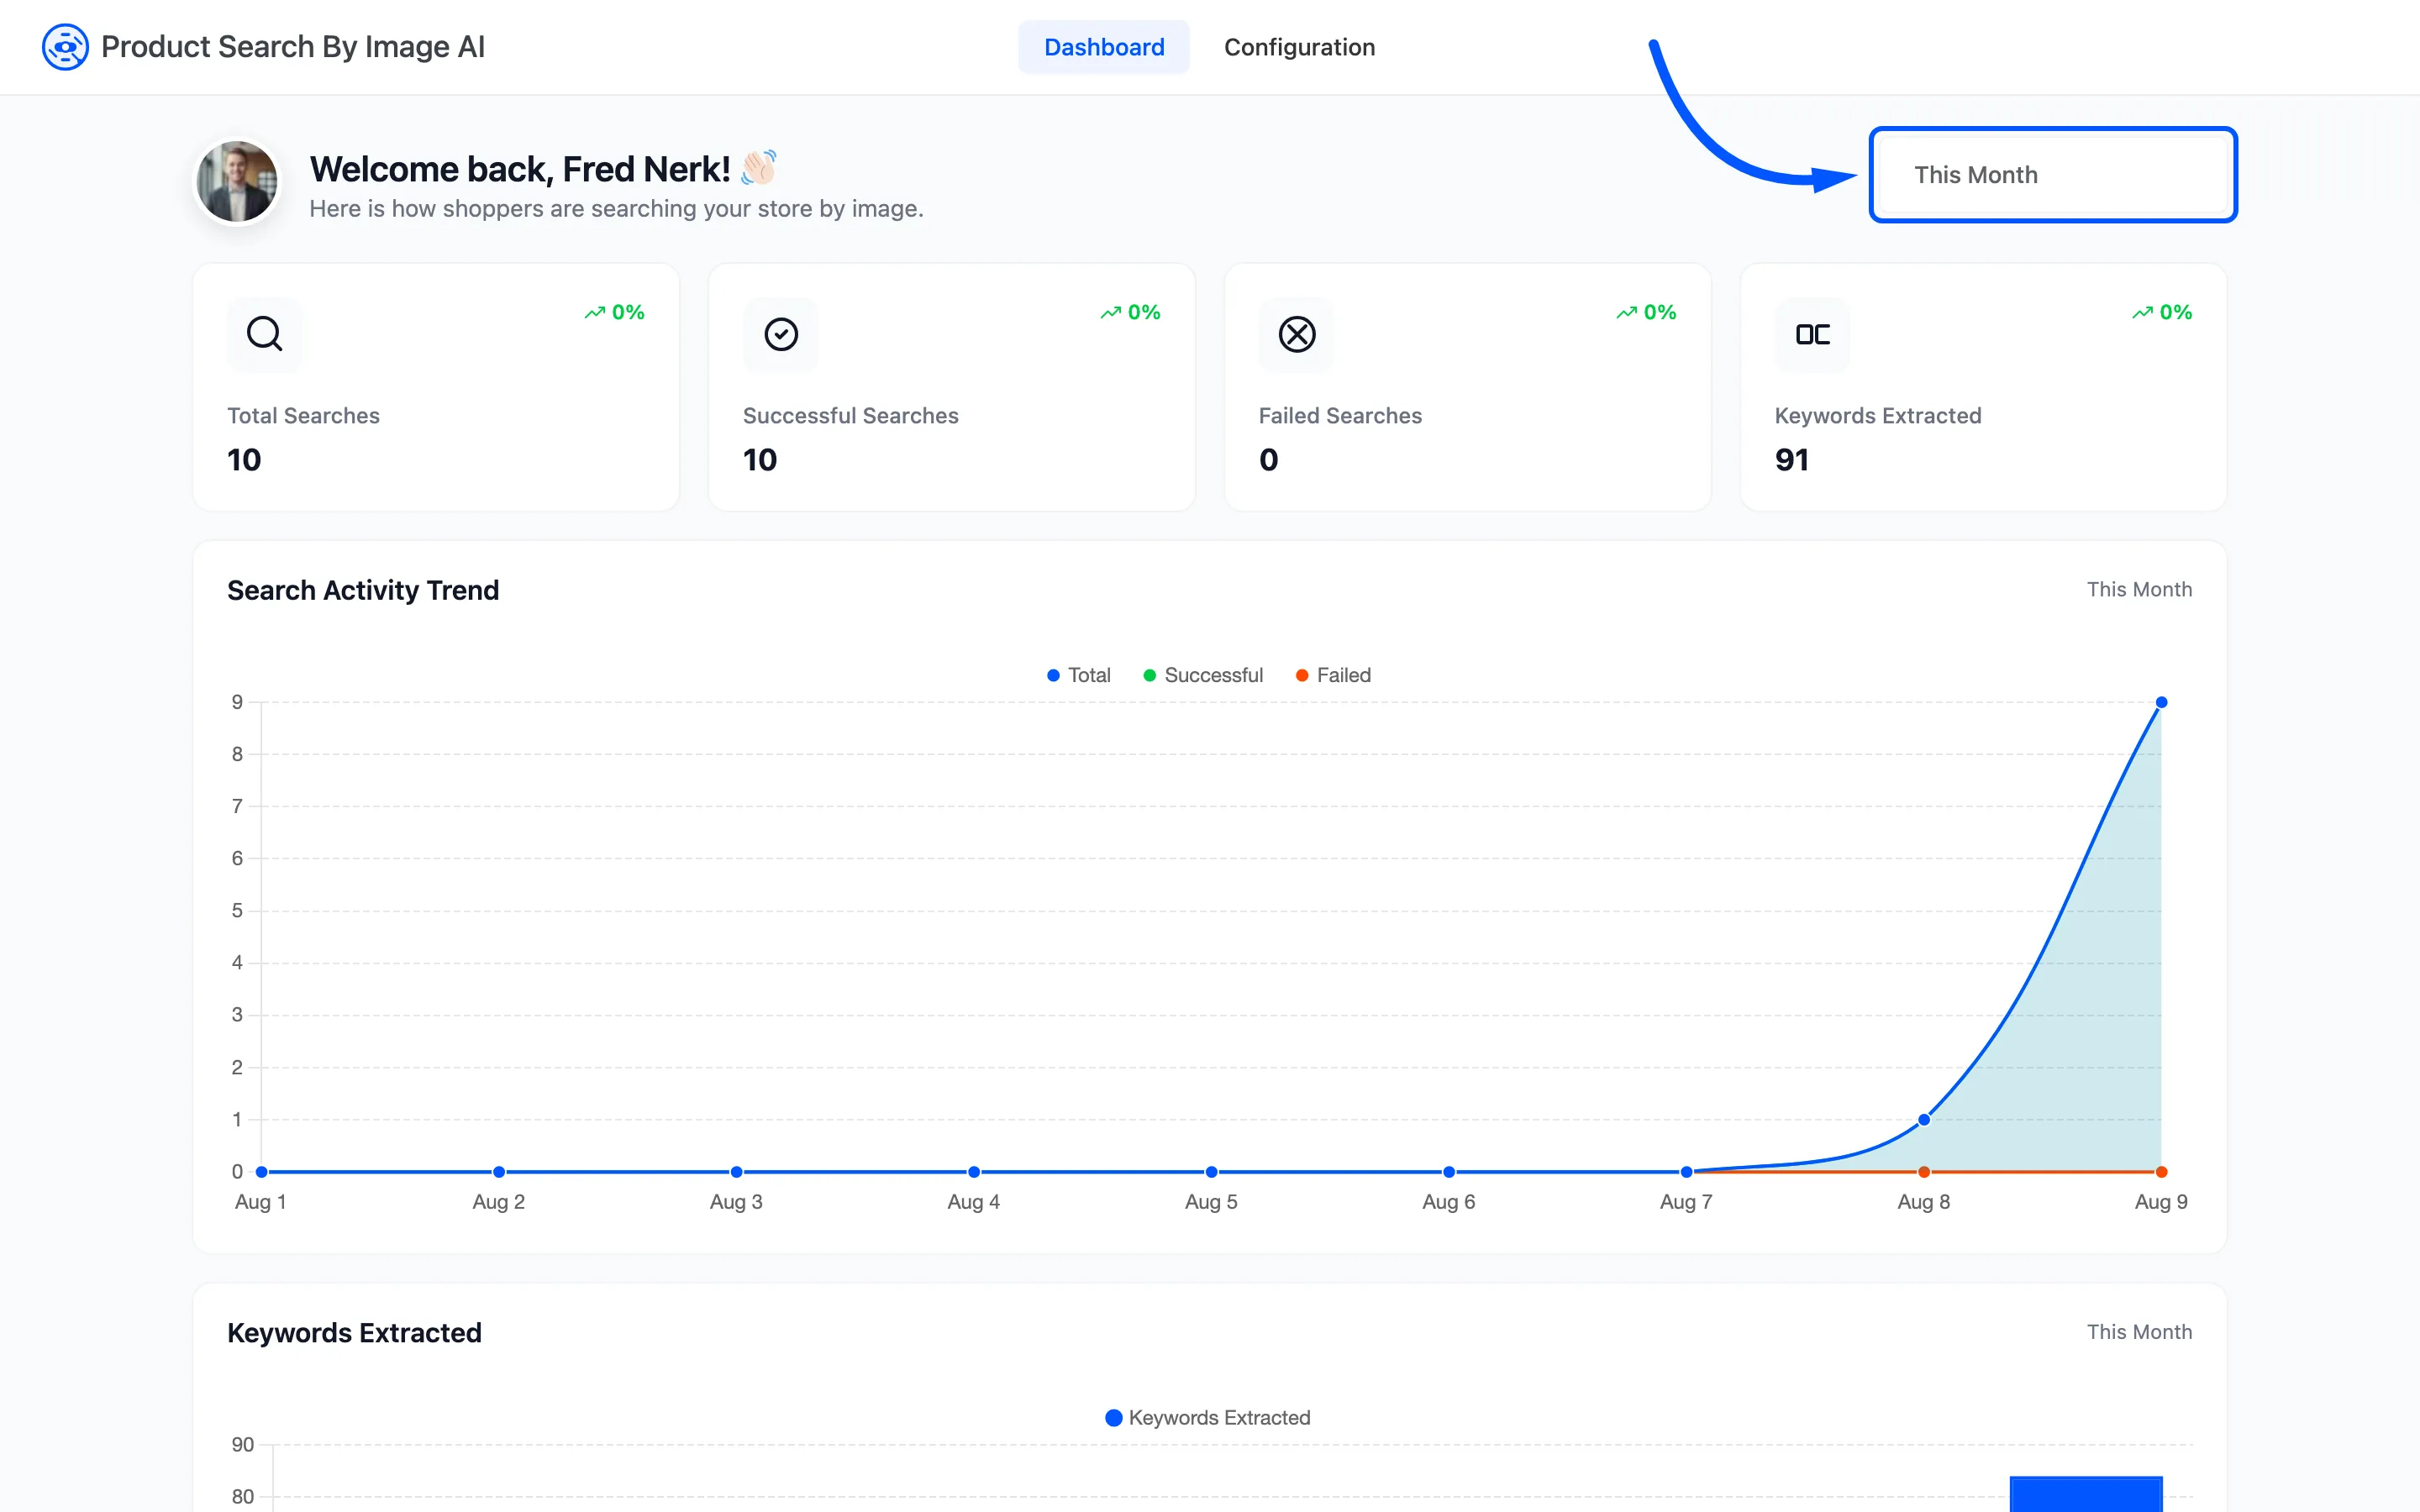
The control in the header sets the range for both charts, from a preset or a custom range. The four counters stay on lifetime totals whatever you pick.
Use it after any change: switch provider, set the range to the week before and the week after, and read the failure line. Under a day the charts move to hourly points, and over about a year to monthly ones.
The number the dashboard does not show
Section titled “The number the dashboard does not show”How often a search found products. The plugin counts keywords, not results, so a search that produced ten good words and matched nothing in your catalogue reads as a success here.
That gap is the one worth closing by hand. Take your own product photos, search them on your storefront, and see whether the products come back.
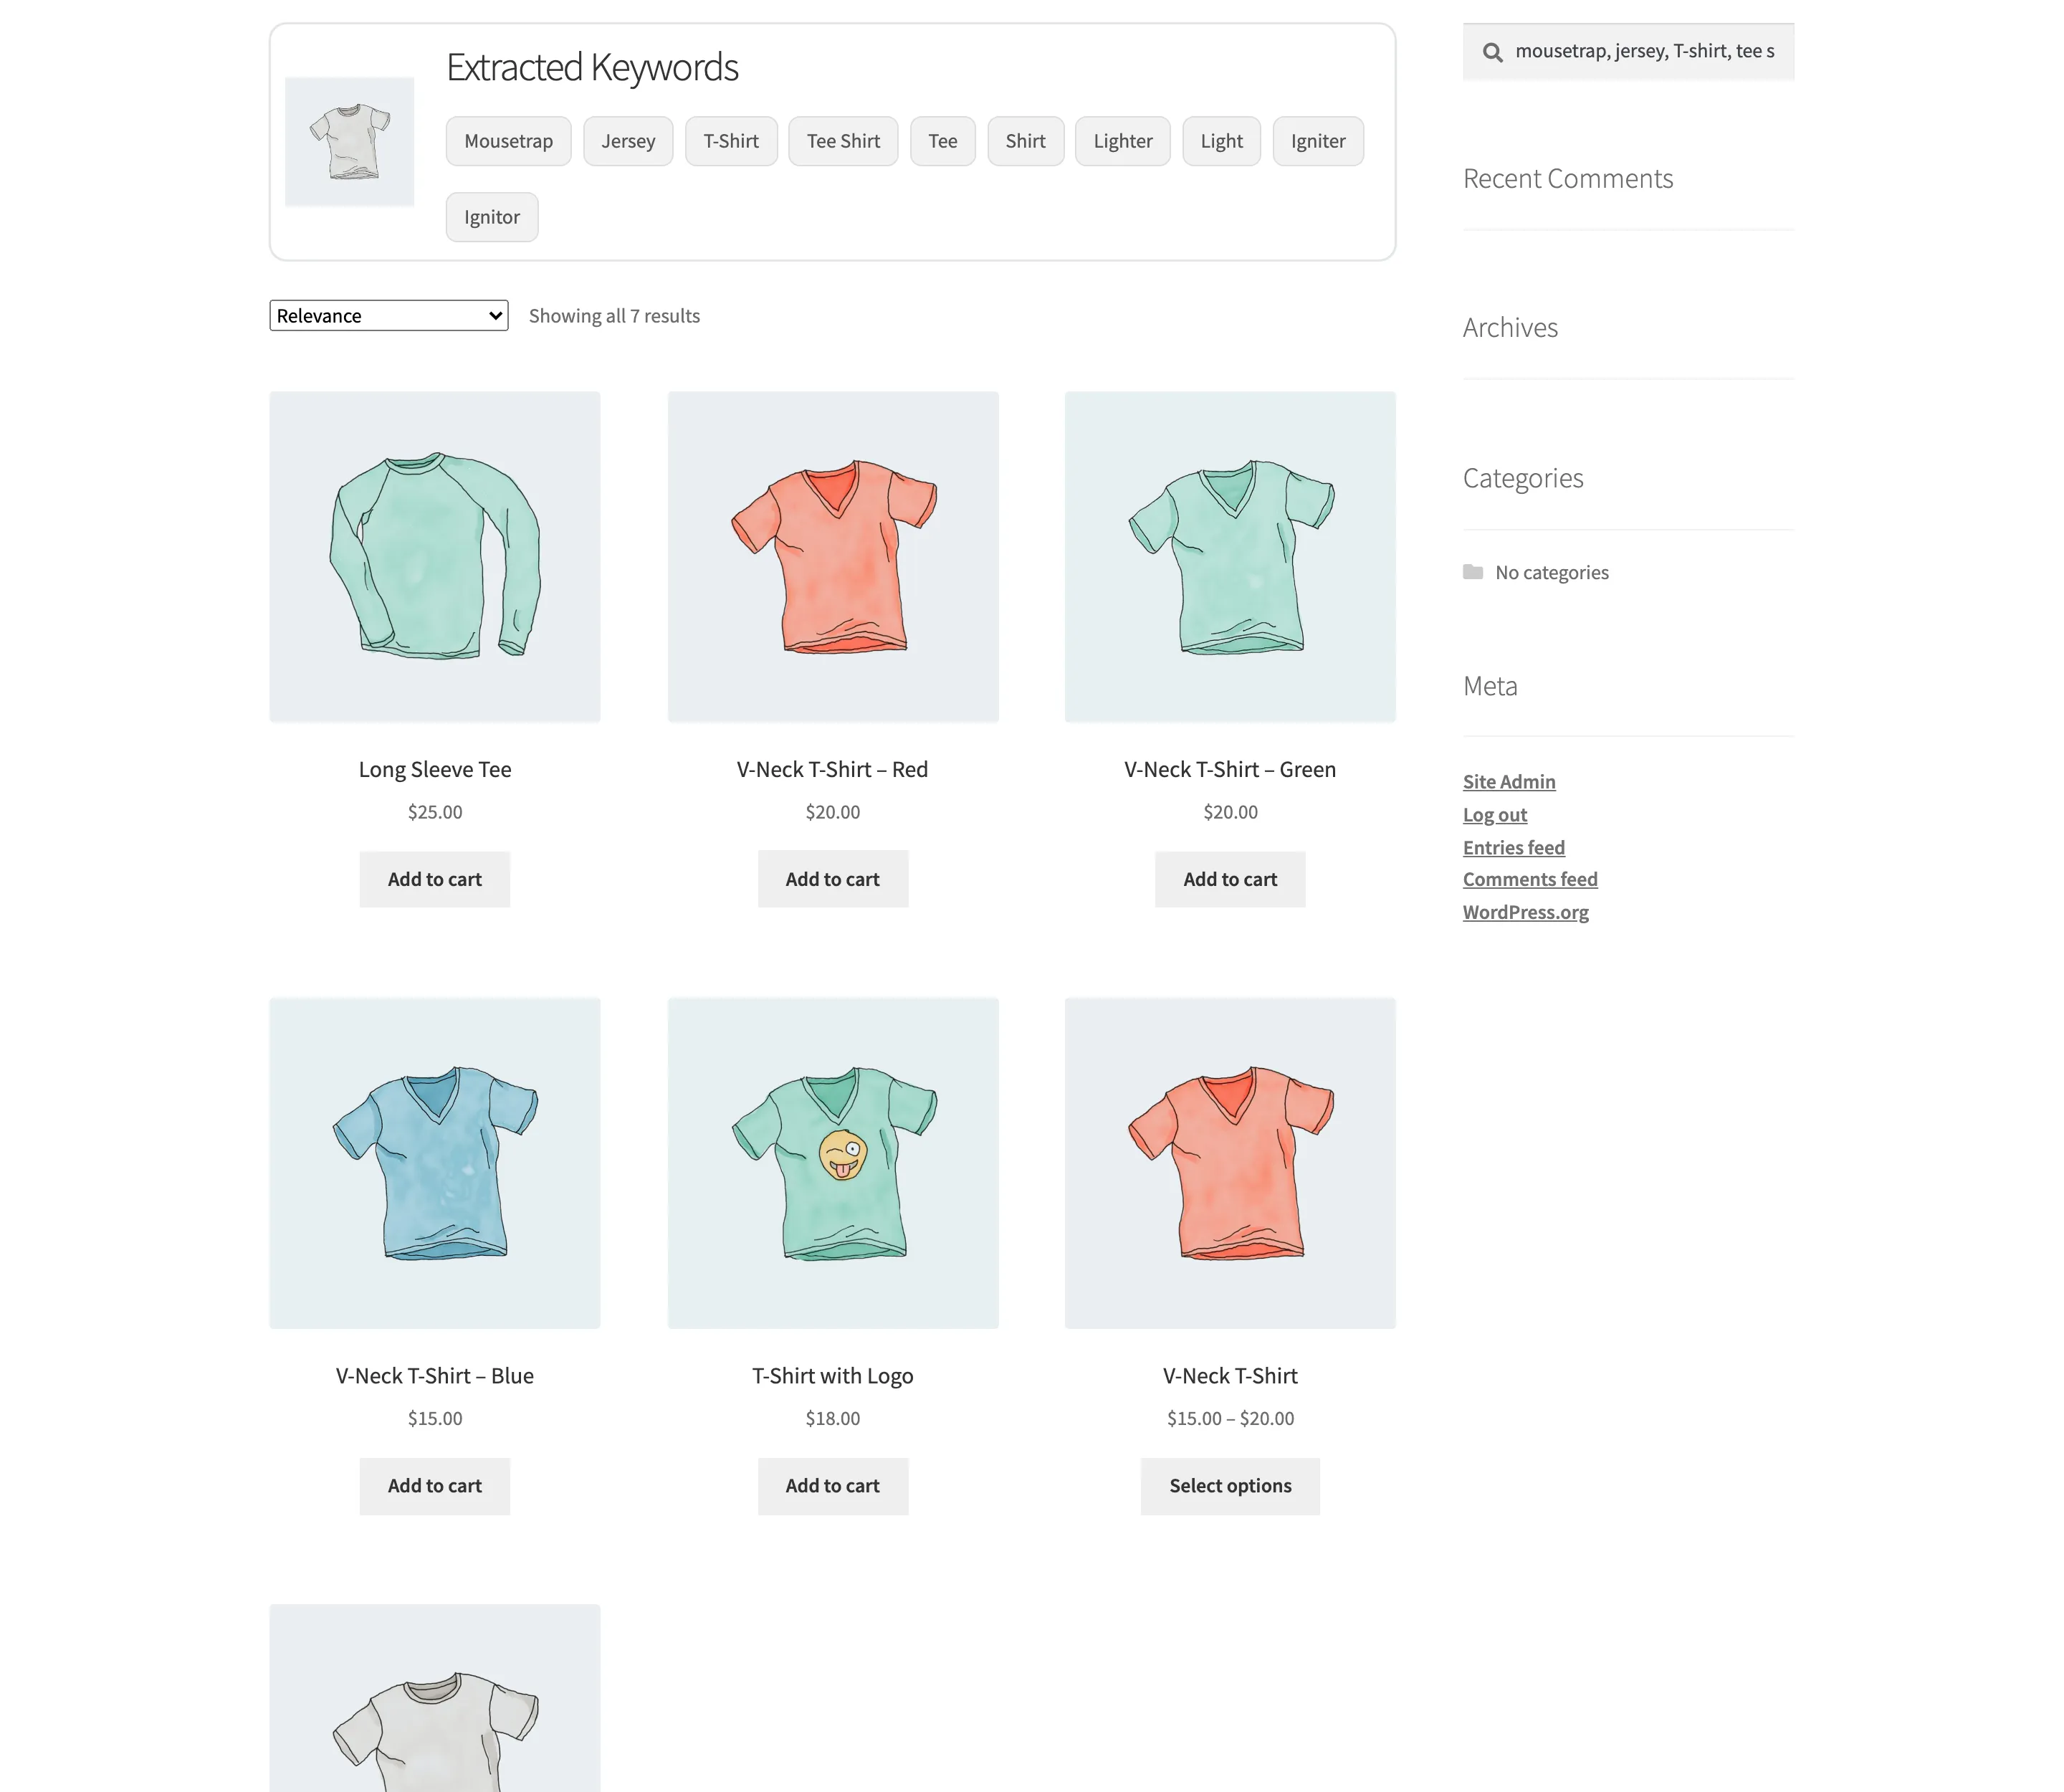
Where sensible words come back and no products do, the fix is image tags, not another setting.