

The Dashboard
The dashboard answers one question: are shoppers using image search, and is it working for them.
Go to DevDiggers Plugins → Product Search By Image AI → Dashboard.
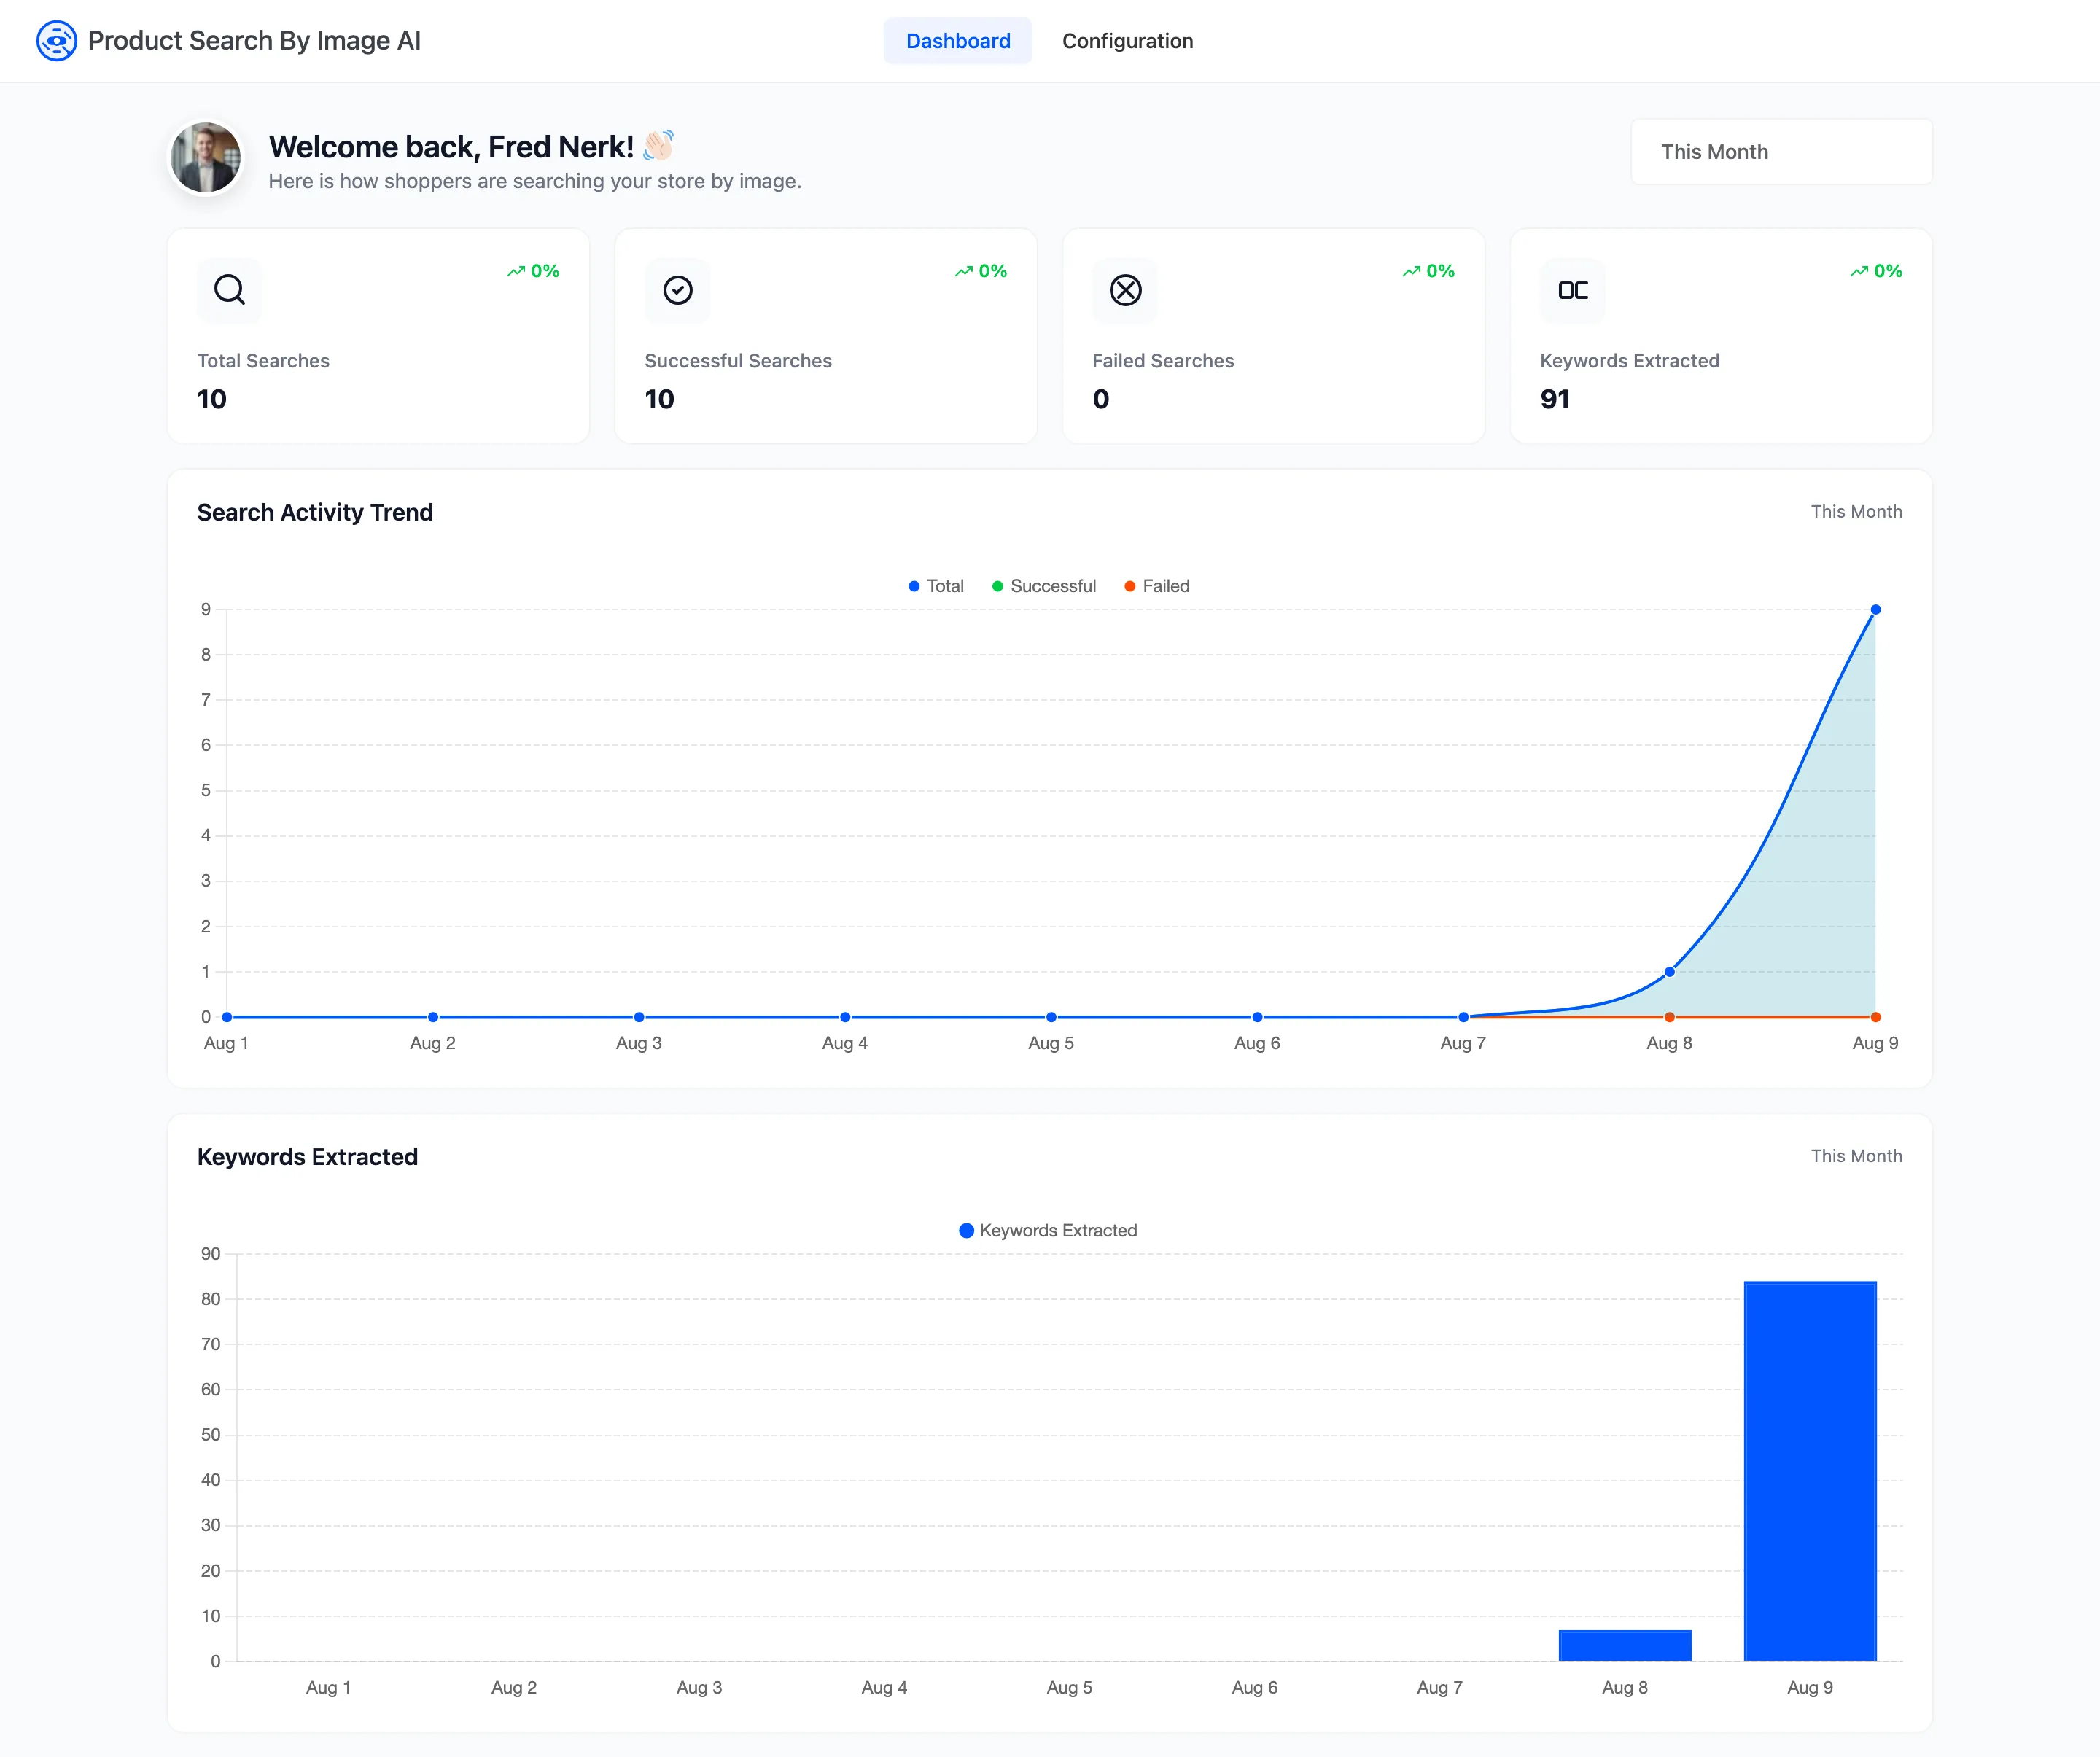
Every number here comes from real searches on your storefront. Nothing in the admin writes to it, so a brand new install shows zeros until the first shopper uploads a photo.
The four counters
Section titled “The four counters”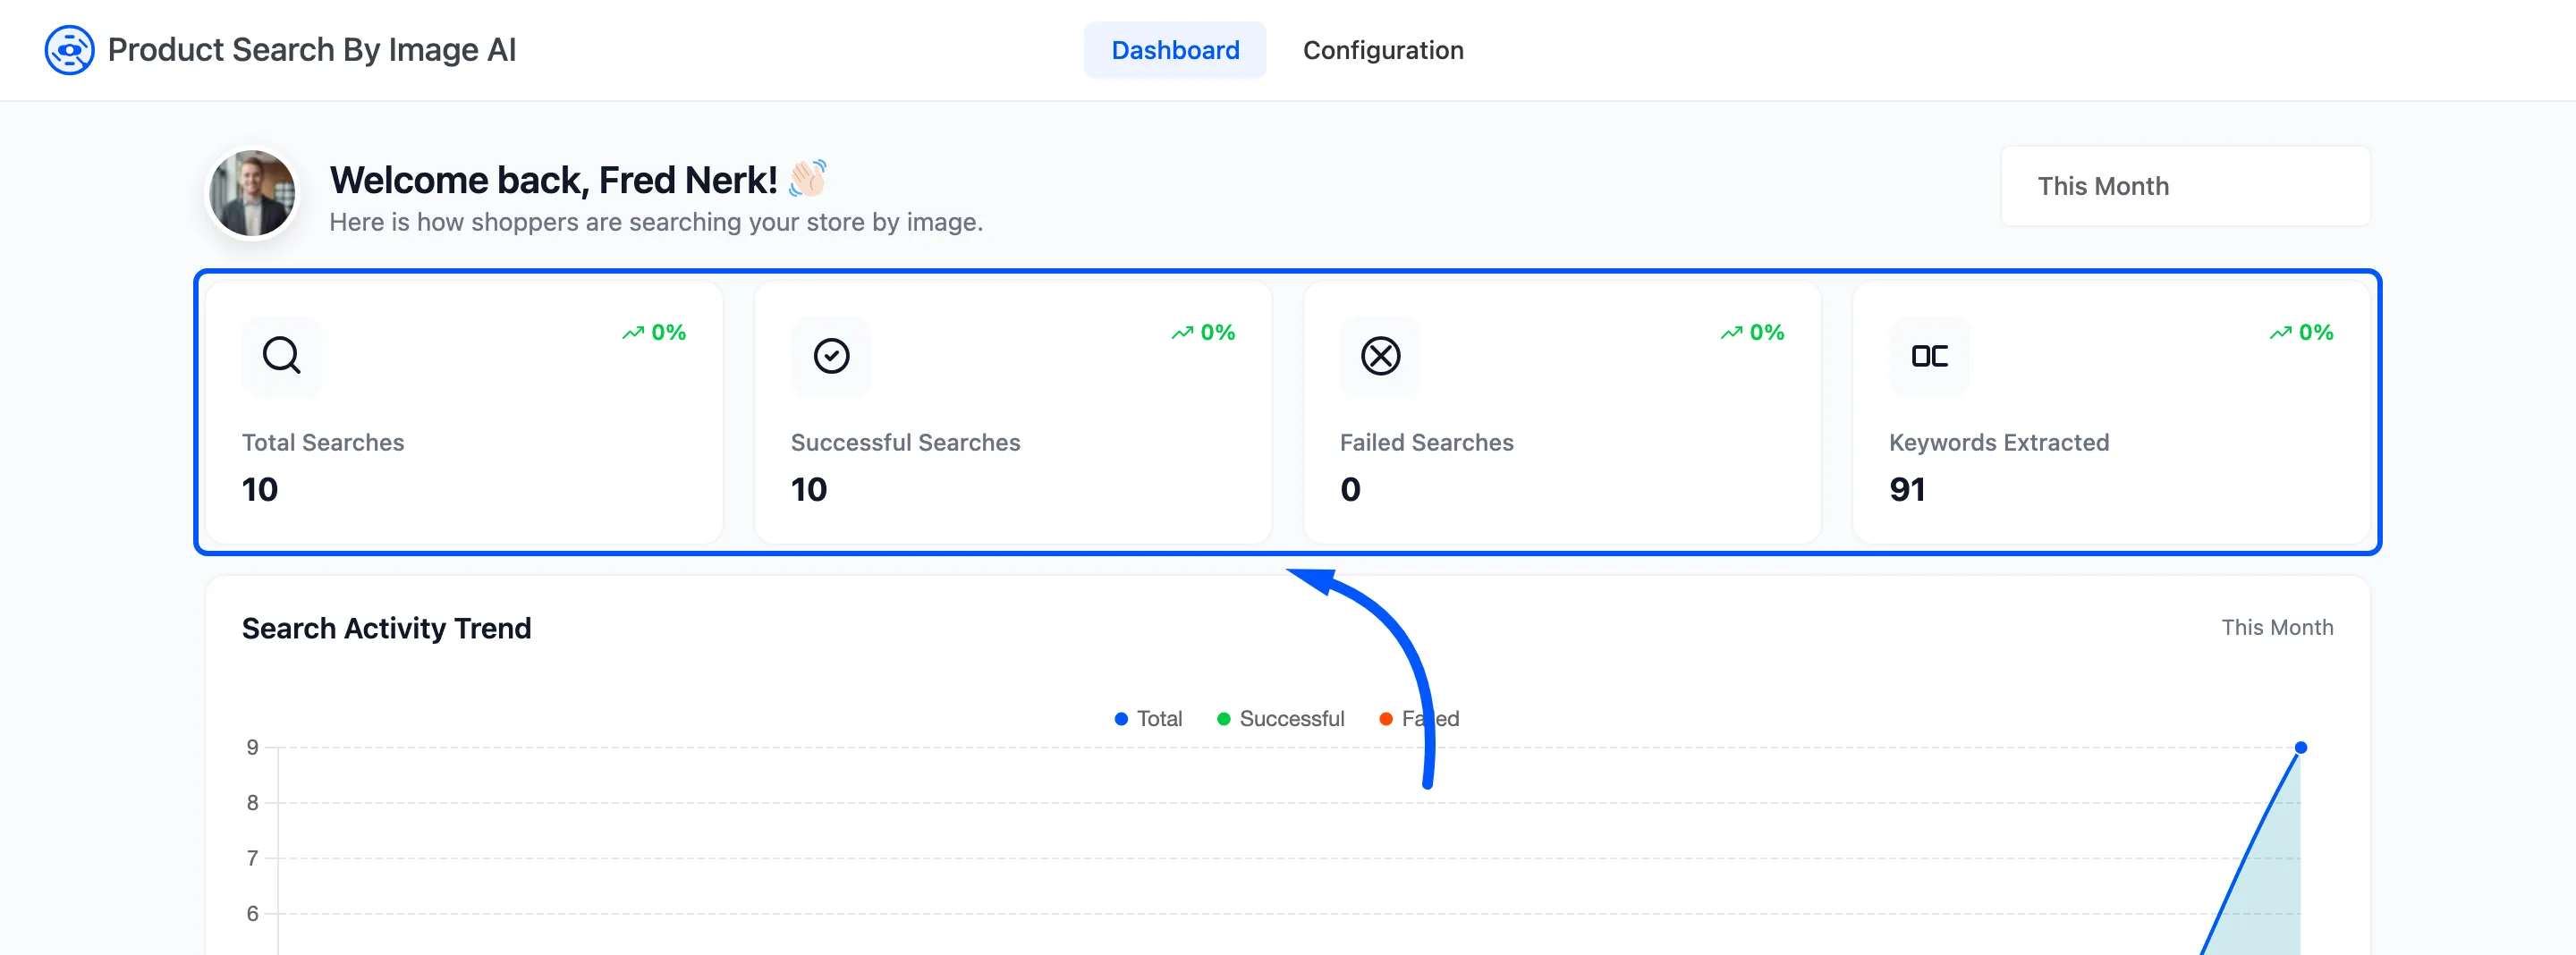
- Total Searches: Every photo a shopper has ever submitted.
- Successful Searches: The ones where the AI service returned at least one keyword.
- Failed Searches: The ones where it returned none, or errored.
- Keywords Extracted: How many words came out of all those photos in total.
The counters are lifetime totals and the charts are not. Changing the date range moves the two charts and leaves these four alone, which is deliberate: they are the running total for the store.
Successful does not mean the shopper found a product. It means words came out of the photo. A search that produced ten keywords and matched nothing in your catalogue is counted as successful. That gap is worth watching, because it is where image tags earn their keep.
Search Activity Trend
Section titled “Search Activity Trend”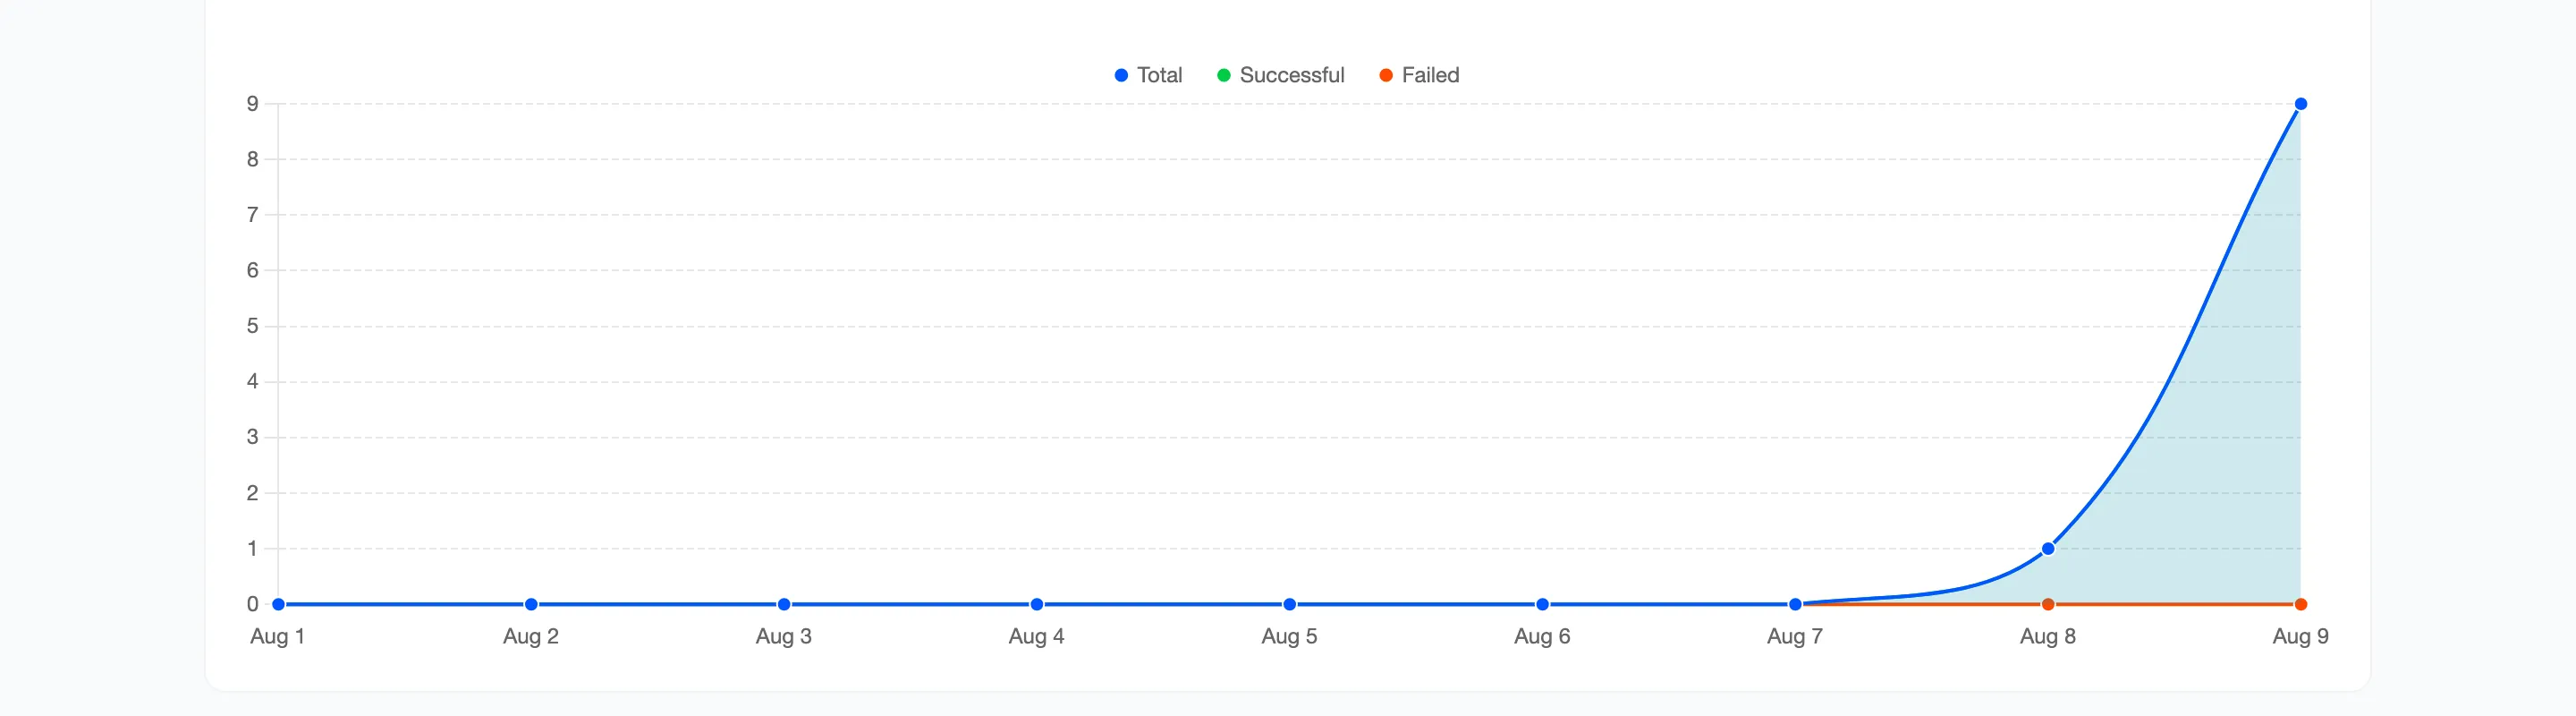
Three lines over the selected range: Total, Successful and Failed. Total and Successful sitting on top of each other is the healthy shape. A Failed line that lifts off the floor means the AI service is refusing work. The usual cause is a missing or exhausted API key on Hugging Face or Google Vision.
Keywords Extracted
Section titled “Keywords Extracted”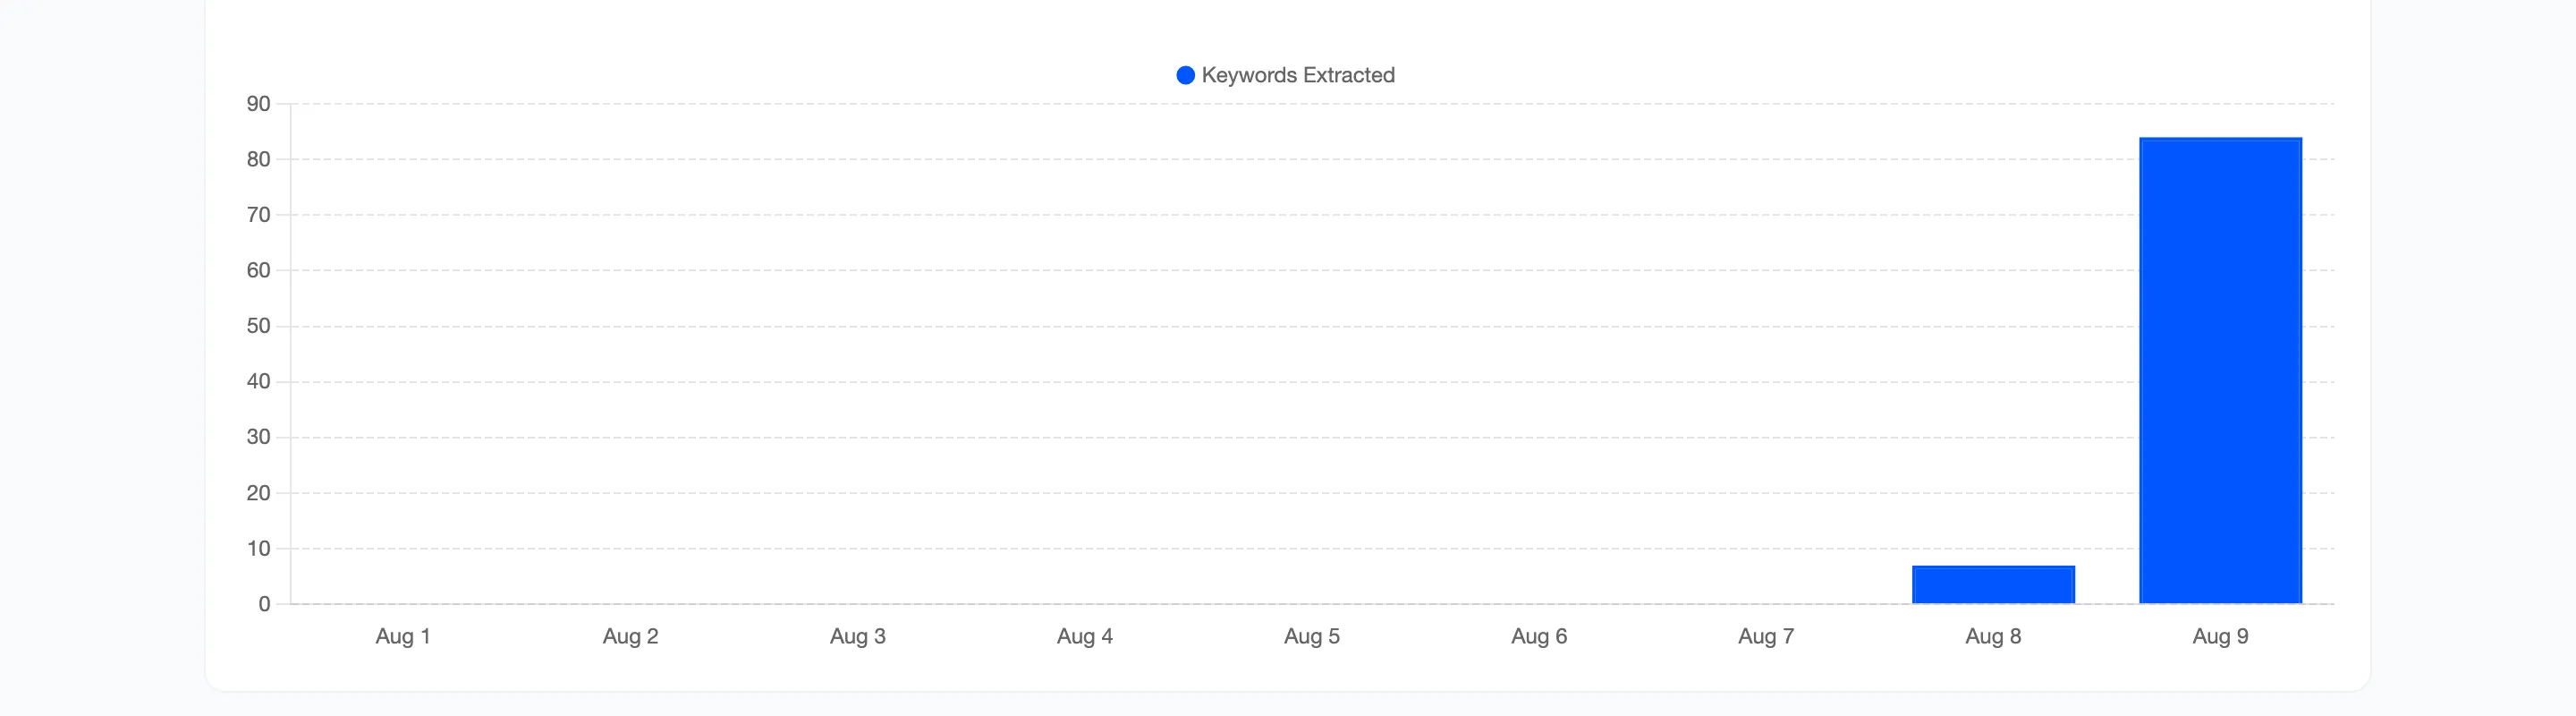
One bar per day, counting the words pulled out of that day’s photos. Read it against the Total line above it. Roughly ten words per search is what the shipped Maximum Number of Keywords of 10 produces. A much lower ratio means photos are coming back with only a word or two, which usually means the photos themselves are hard to read.
The date range
Section titled “The date range”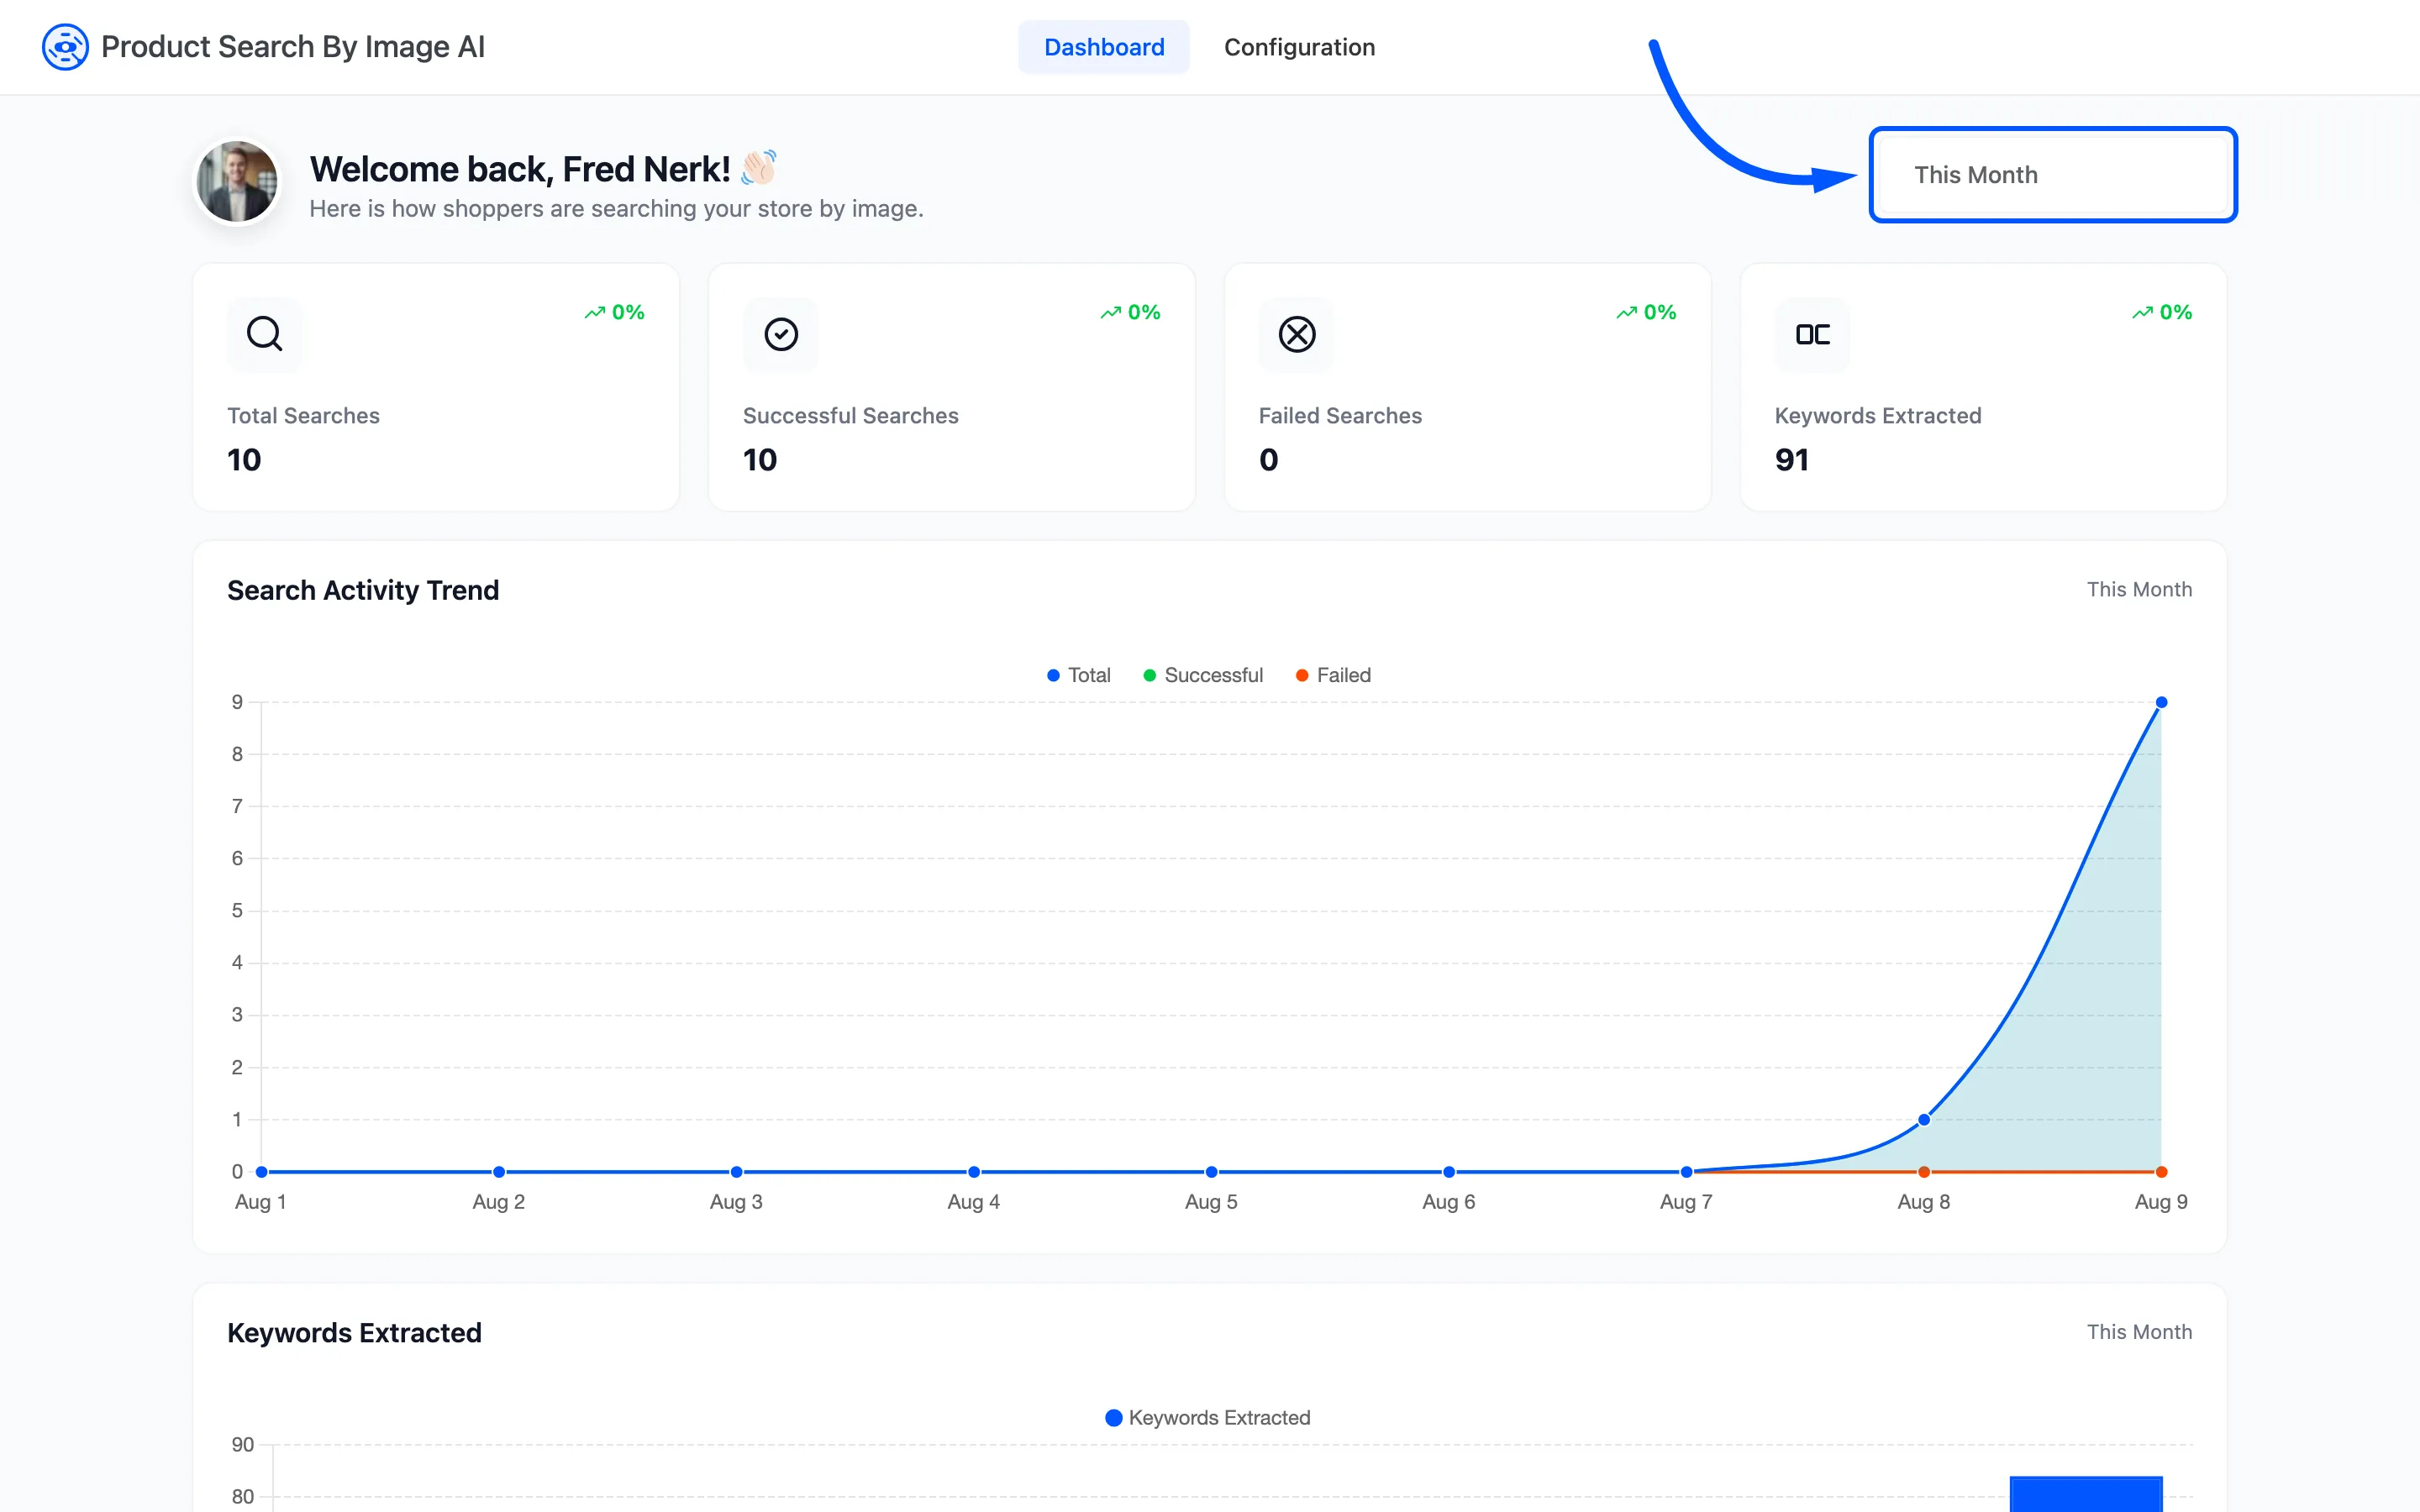
The control in the header sets the range for both charts. It opens a list of presets and a custom range. Both charts redraw together, and the four counters do not move.
Under a day the charts switch to hourly points. Over roughly a year they switch to one point per month, so a wide range stays readable.
What the numbers are kept from
Section titled “What the numbers are kept from”Two tables, filled by the storefront. The daily summary behind the counters and charts is kept for a year. A more detailed per-search log is kept for 30 days and is not shown on any screen. Old activity thins out on its own rather than growing forever.
Both charts and the counters are cached for a few minutes. Right after your own test search the numbers can lag by one; reload after a minute and they agree.